


- Dogecoin edges lower after a 12% recovery last week, struggling to overcome $0.17 resistance.
- Shiba Inu ticks lower by 2% following a trendline breakout, targets $0.00001200 breakout.
- Pepe softens by 2% as it struggles to surpass an overhead trendline.
Meme coins, such as Dogecoin (DOGE), Shiba Inu (SHIB), and Pepe (PEPE), performed remarkably well last week, with a swift recovery reaching a high point on Sunday. The meme coins soften slightly on Monday as bulls struggle to overcome critical resistance, while a breakout could trigger extended gains.
Dogecoin’s reversal run hits a roadblock
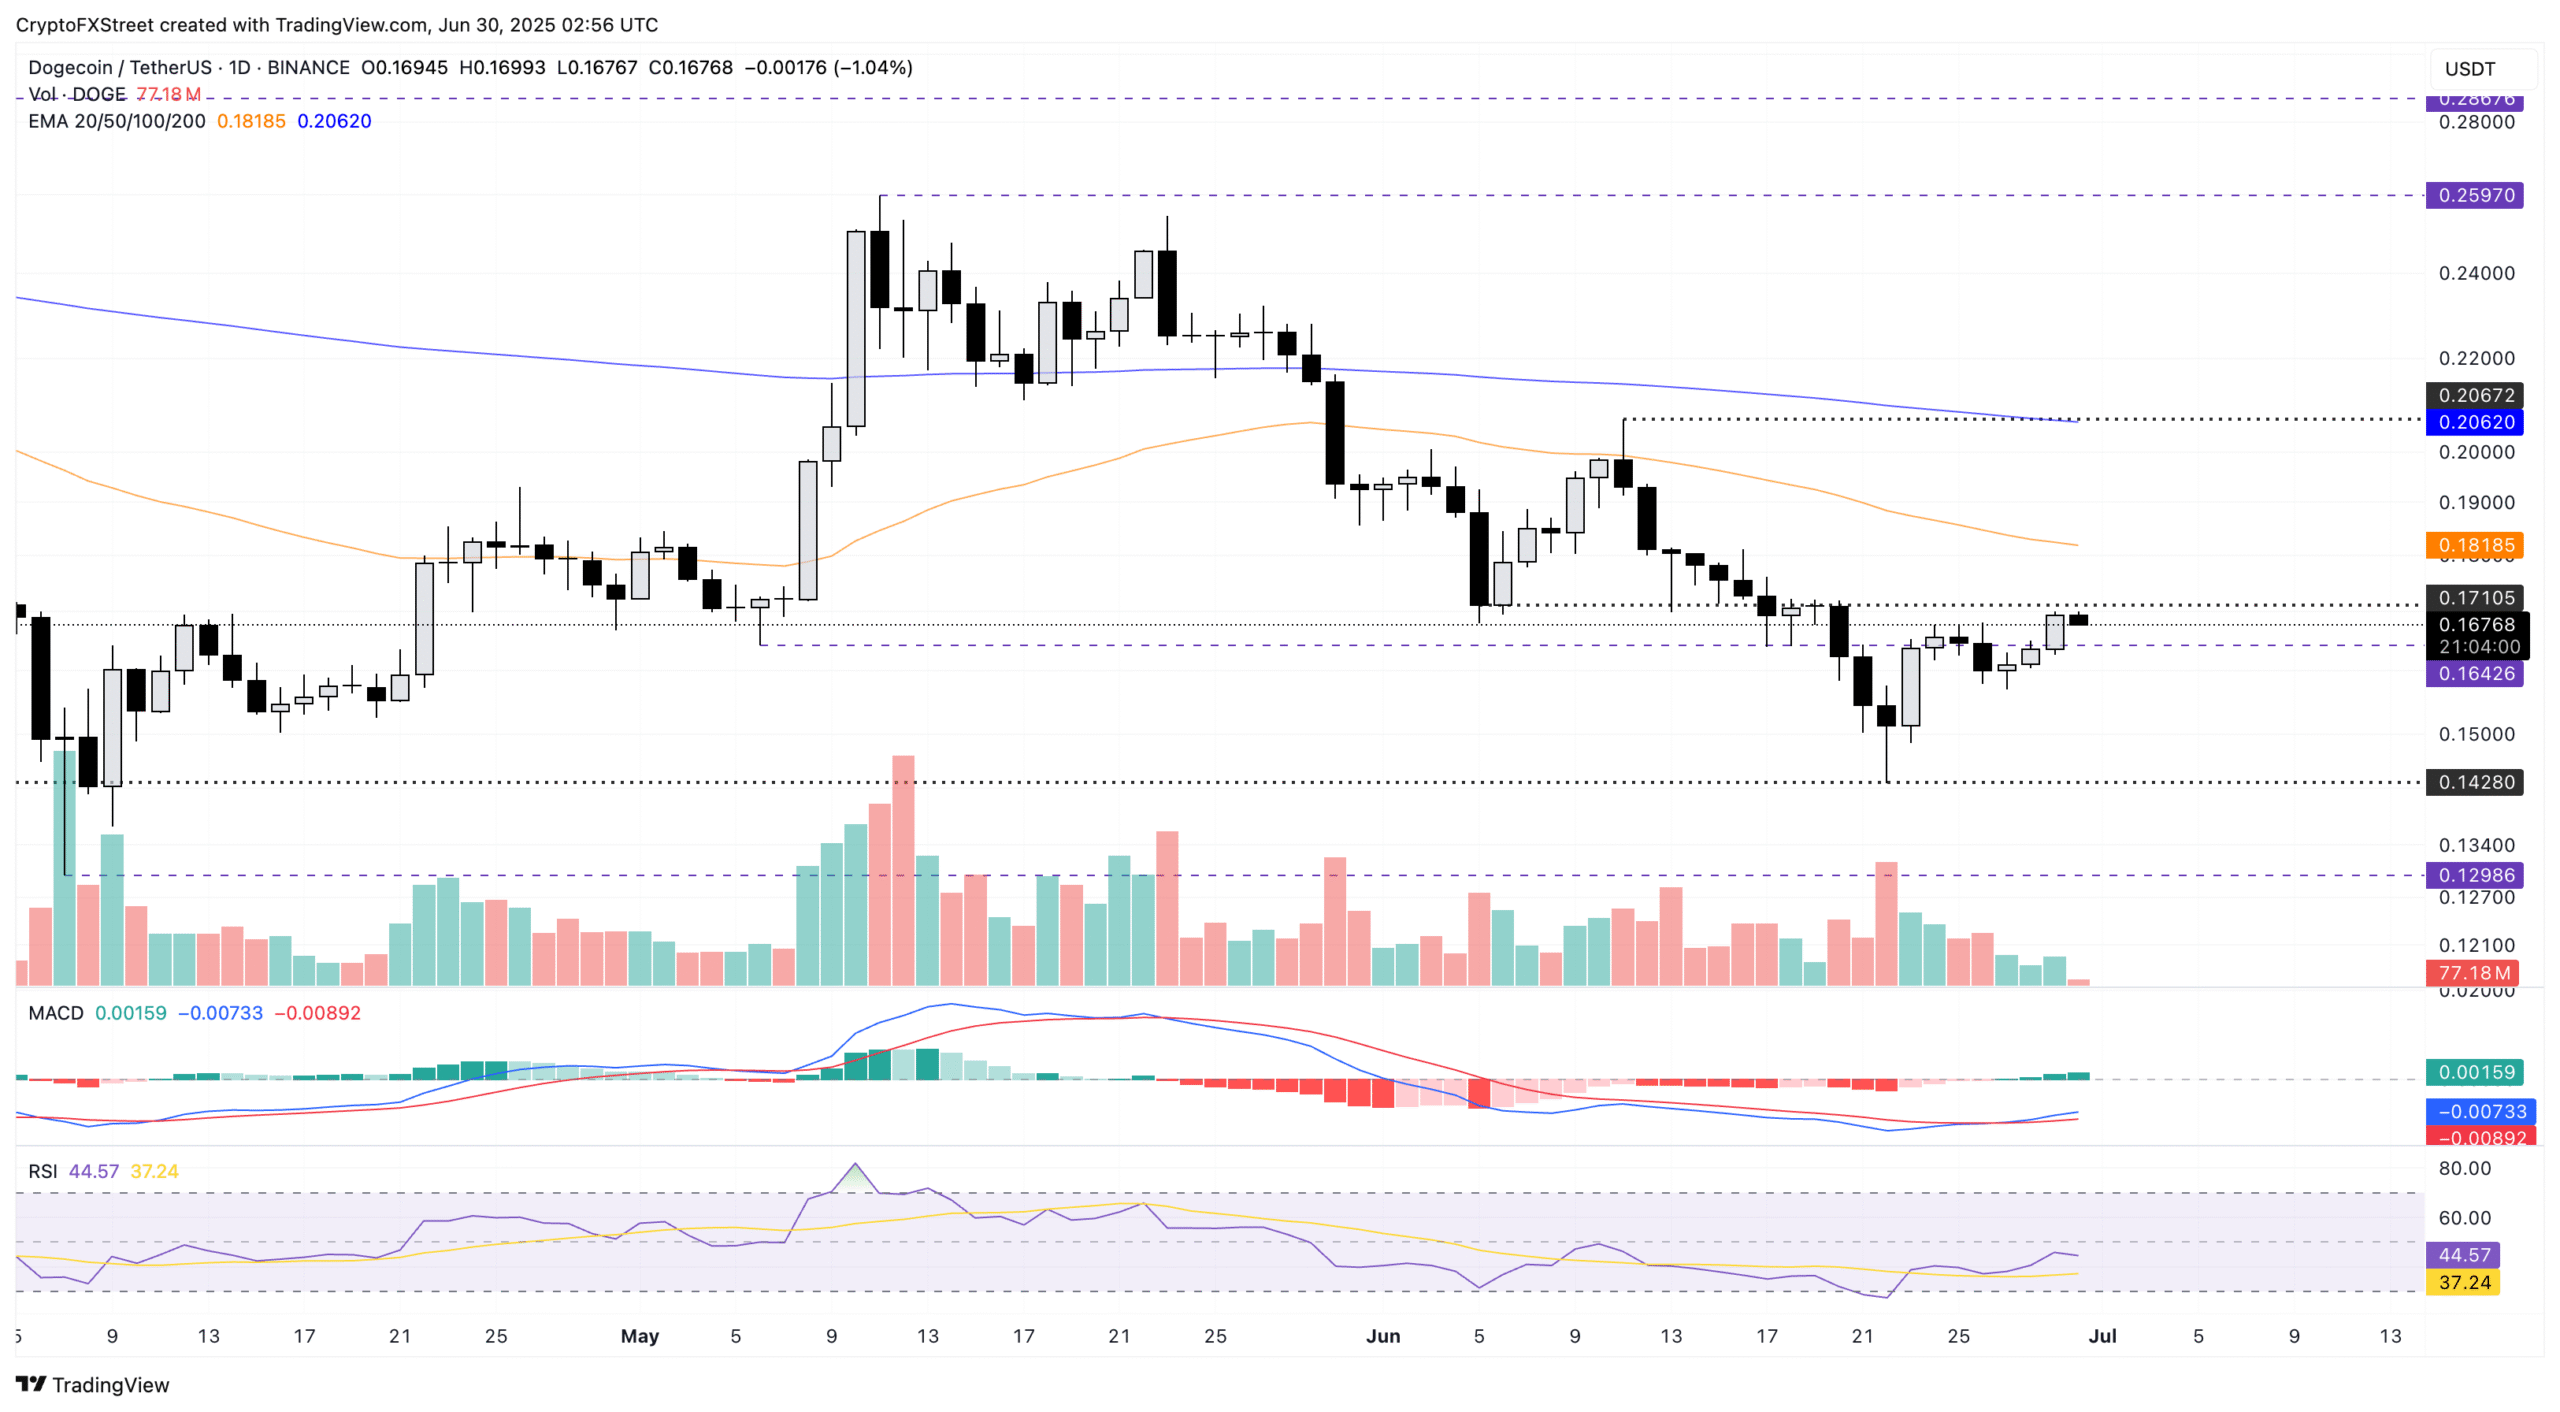
Dogecoin dropped 1% at press time on Monday, losing steam after a bullish recovery week of 12%. Starting the week on a soft note, DOGE struggles to overcome the $0.17 resistance last tested on June 19.
A daily close above this level could extend the meme coin’s recovery towards the monthly high at $0.20 psychological level.
The Moving Average Convergence/Divergence (MACD) indicator displays a bullish crossover (MACD line crossing above its signal line), triggering a trend reversal signal.
The Relative Strength Index (RSI) at 44 gradually reverses from the oversold zone, indicating a decline in overhead supply pressure.
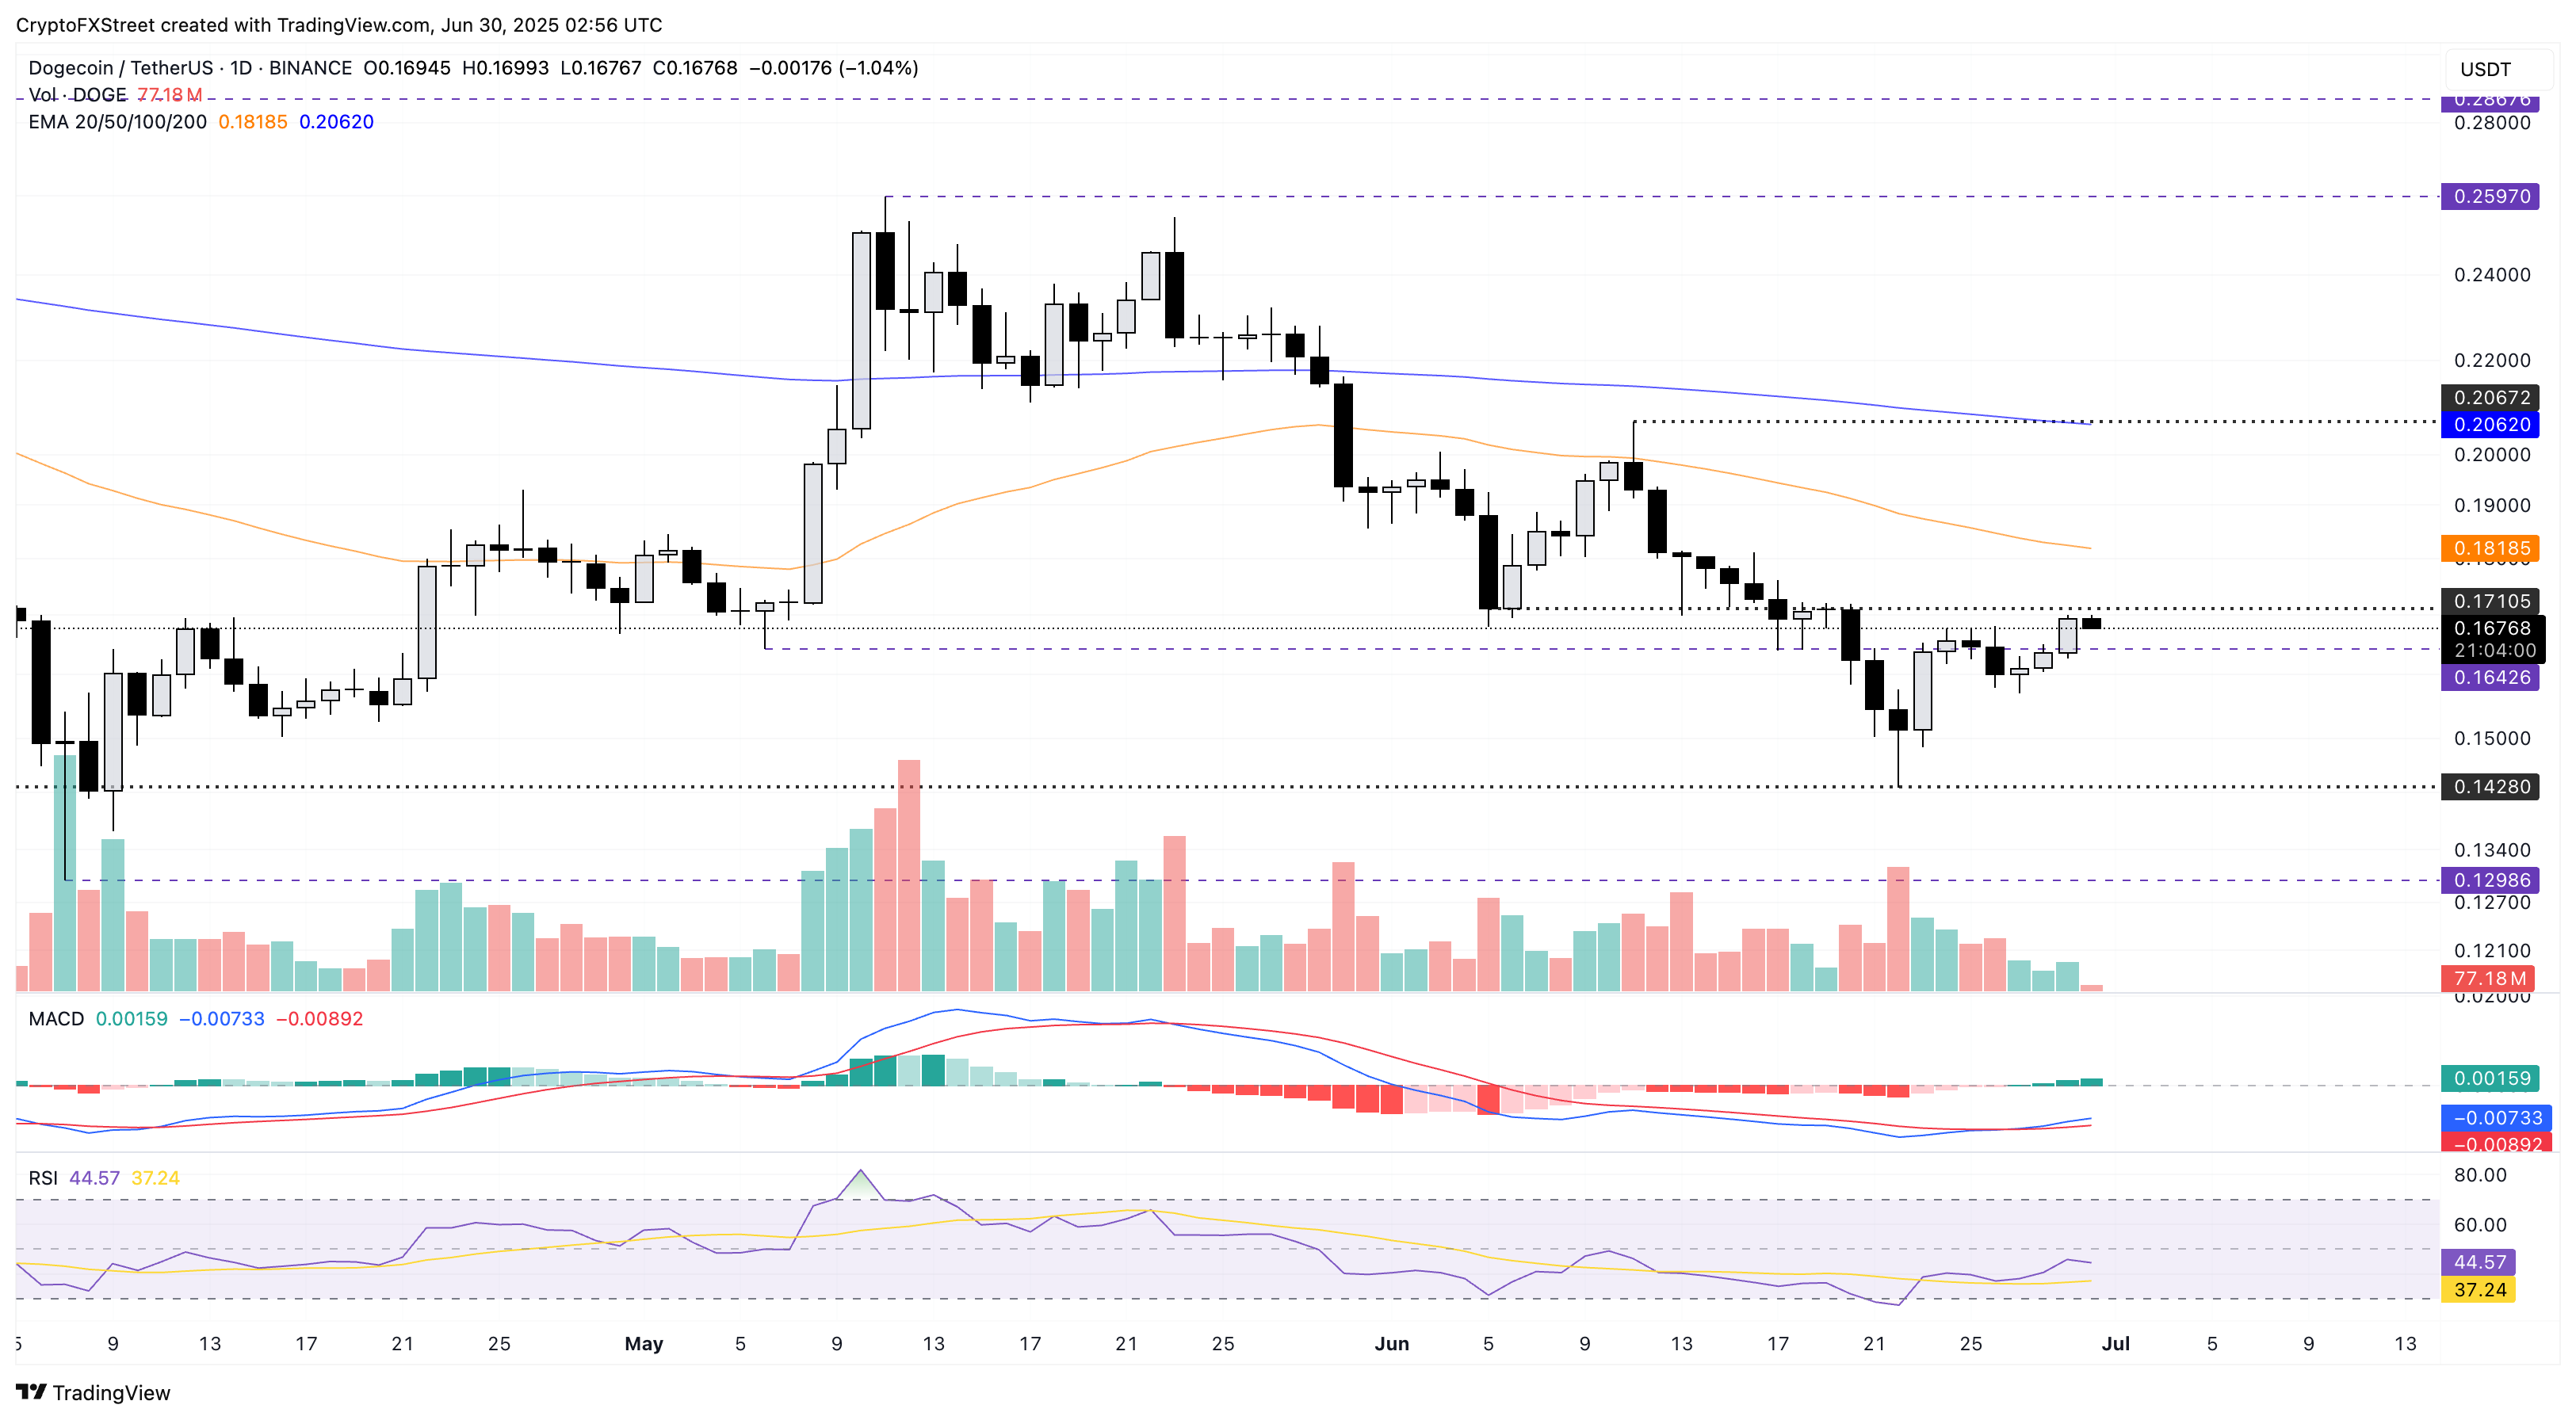
DOGE/USDT daily price chart.
A failure to surpass the $0.17 resistance could result in a retest of the $0.14 support, marked by the low on June 22.
Shiba Inu’s trendline breakout rally lags momentum
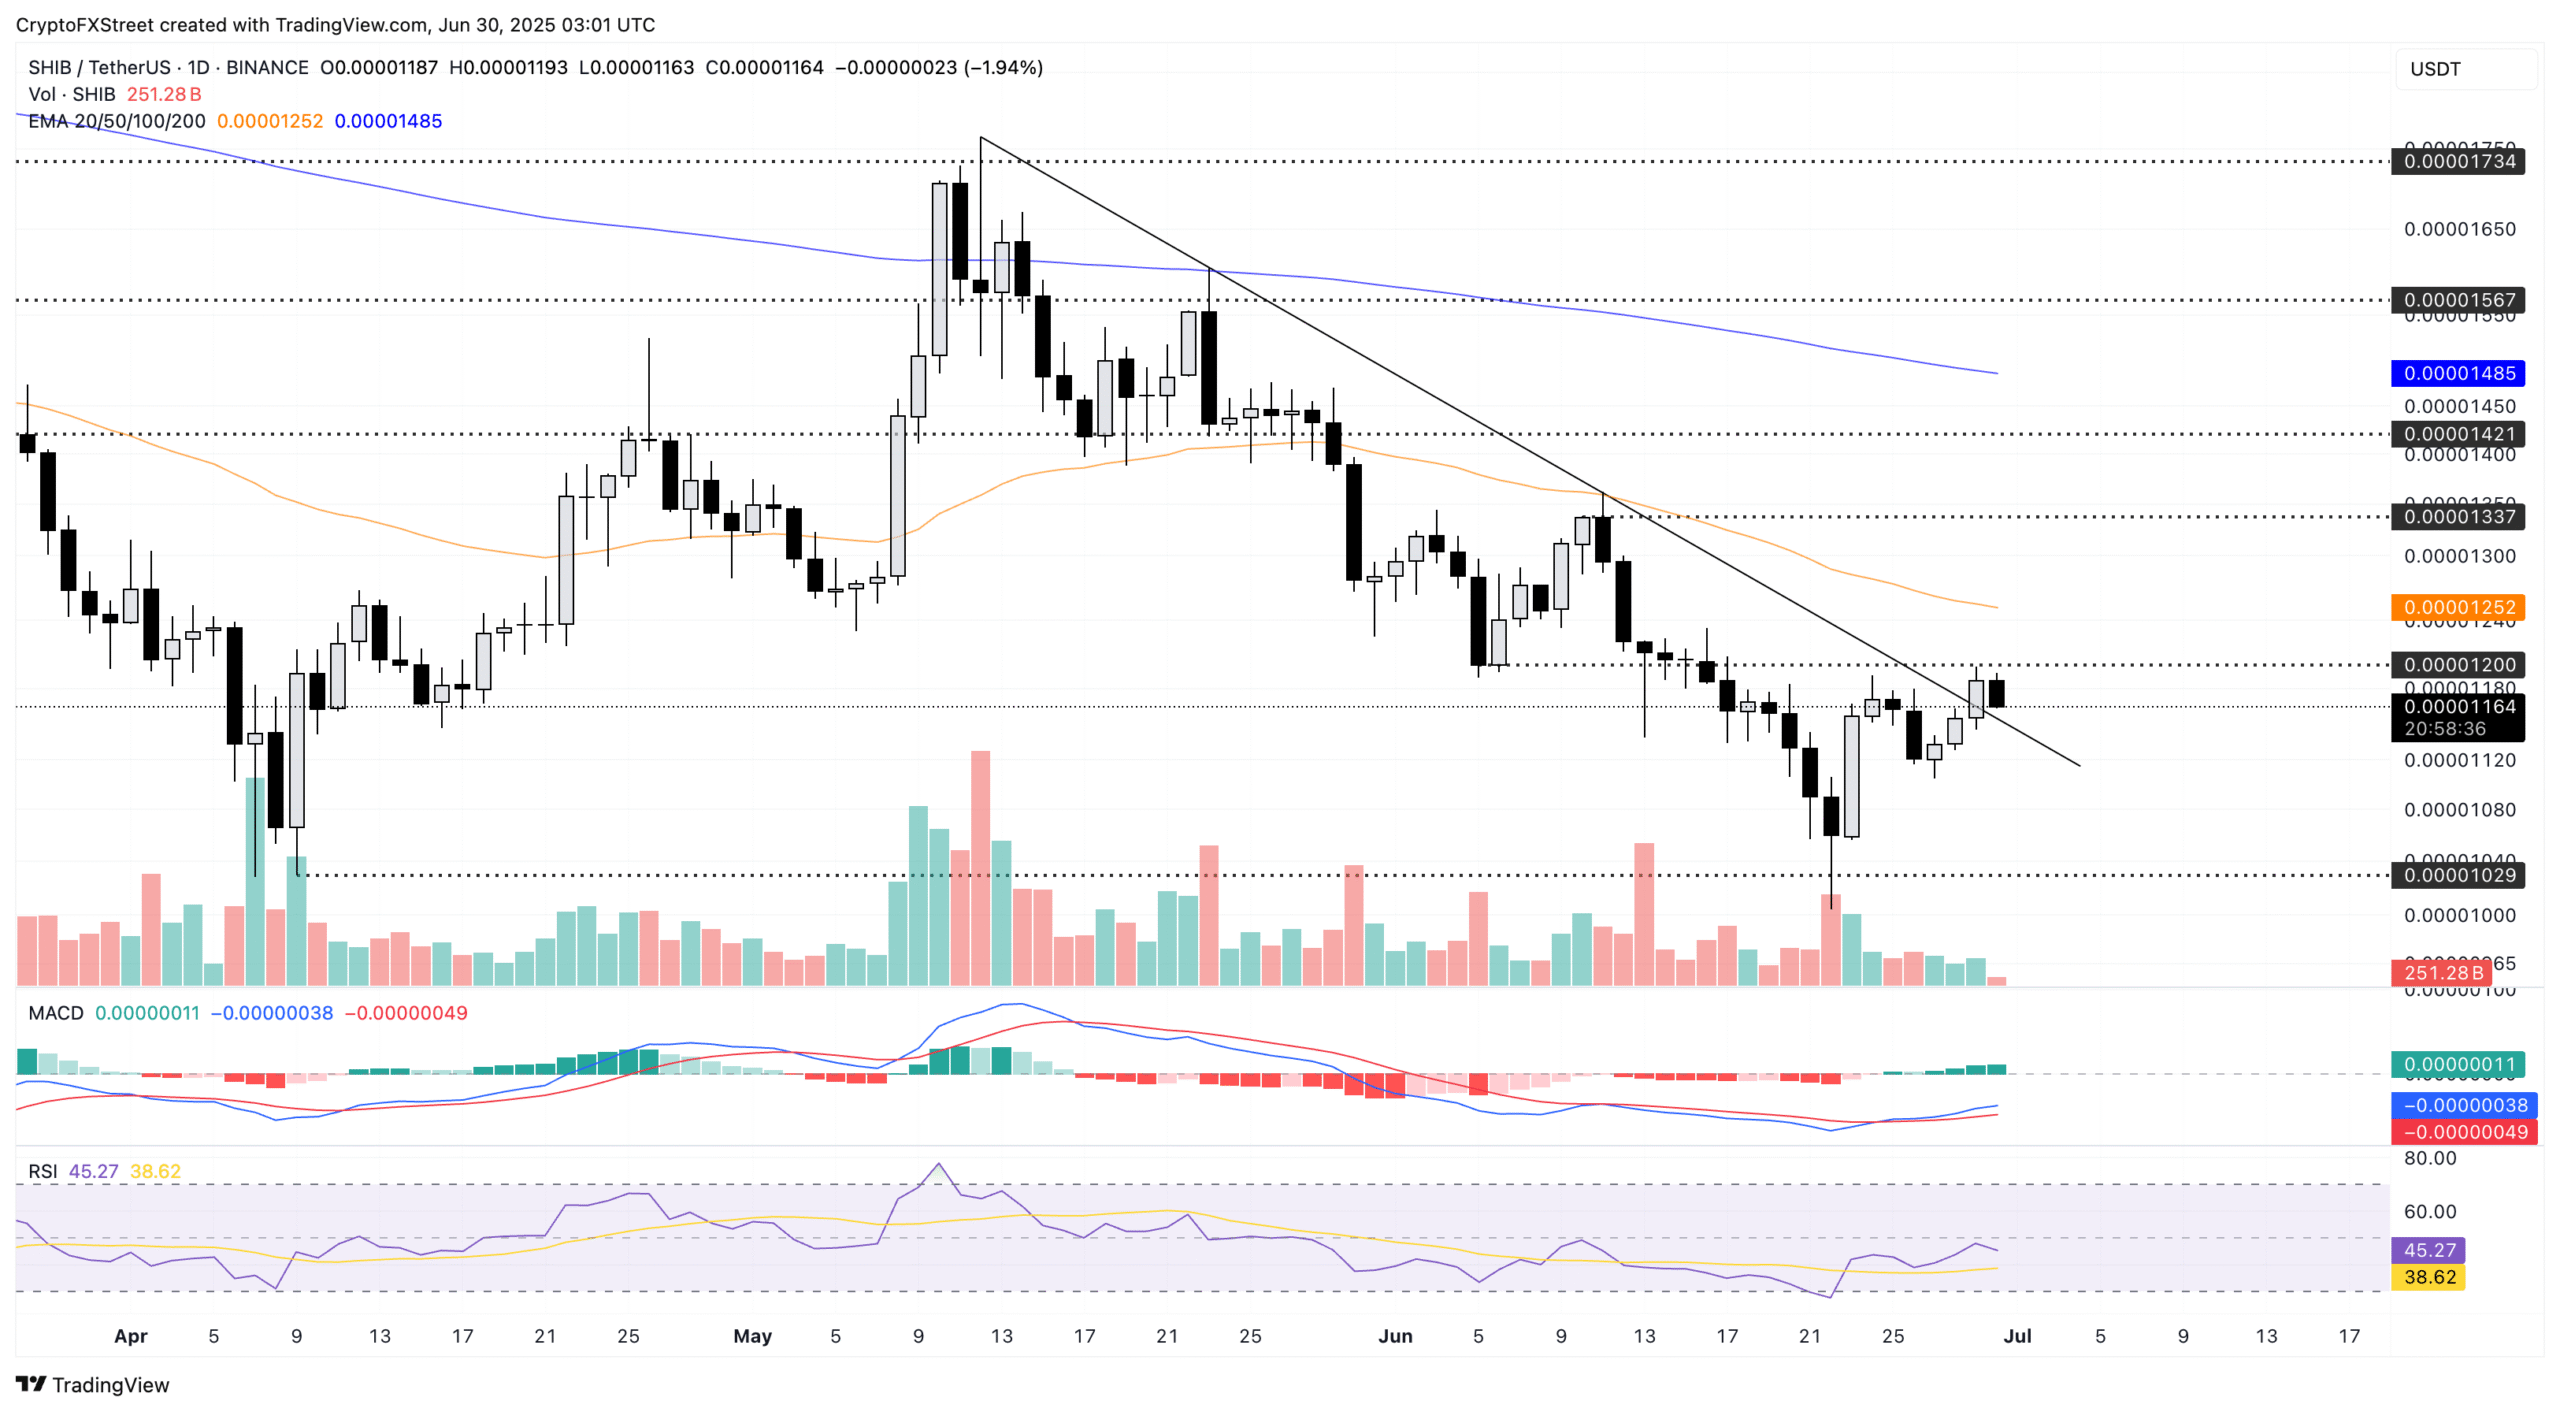
Similar to DOGE, Shiba Inu surged 12% last week, extending its recovery to challenge the $0.00001200 resistance marked by the June 5 closing price. At the time of writing, SHIB is down nearly 2% struggling to hold onto the 2.77% surge from Sunday.
Further up, the meme coin crosses above a resistance trendline formed by the highest prices on May 12, May 23, and June 11, suggesting a trend reversal. A potential close above the $0.00001200 resistance could extend the SHIB recovery to the 50-day Exponential Moving Average (EMA) at $0.00001252.
The MACD indicator displays a streak of rising green histogram bars from the zero line, suggesting an uptrend in motion.
The RSI at 45 bounces off the oversold boundary, indicating a diminishing bearish influence.
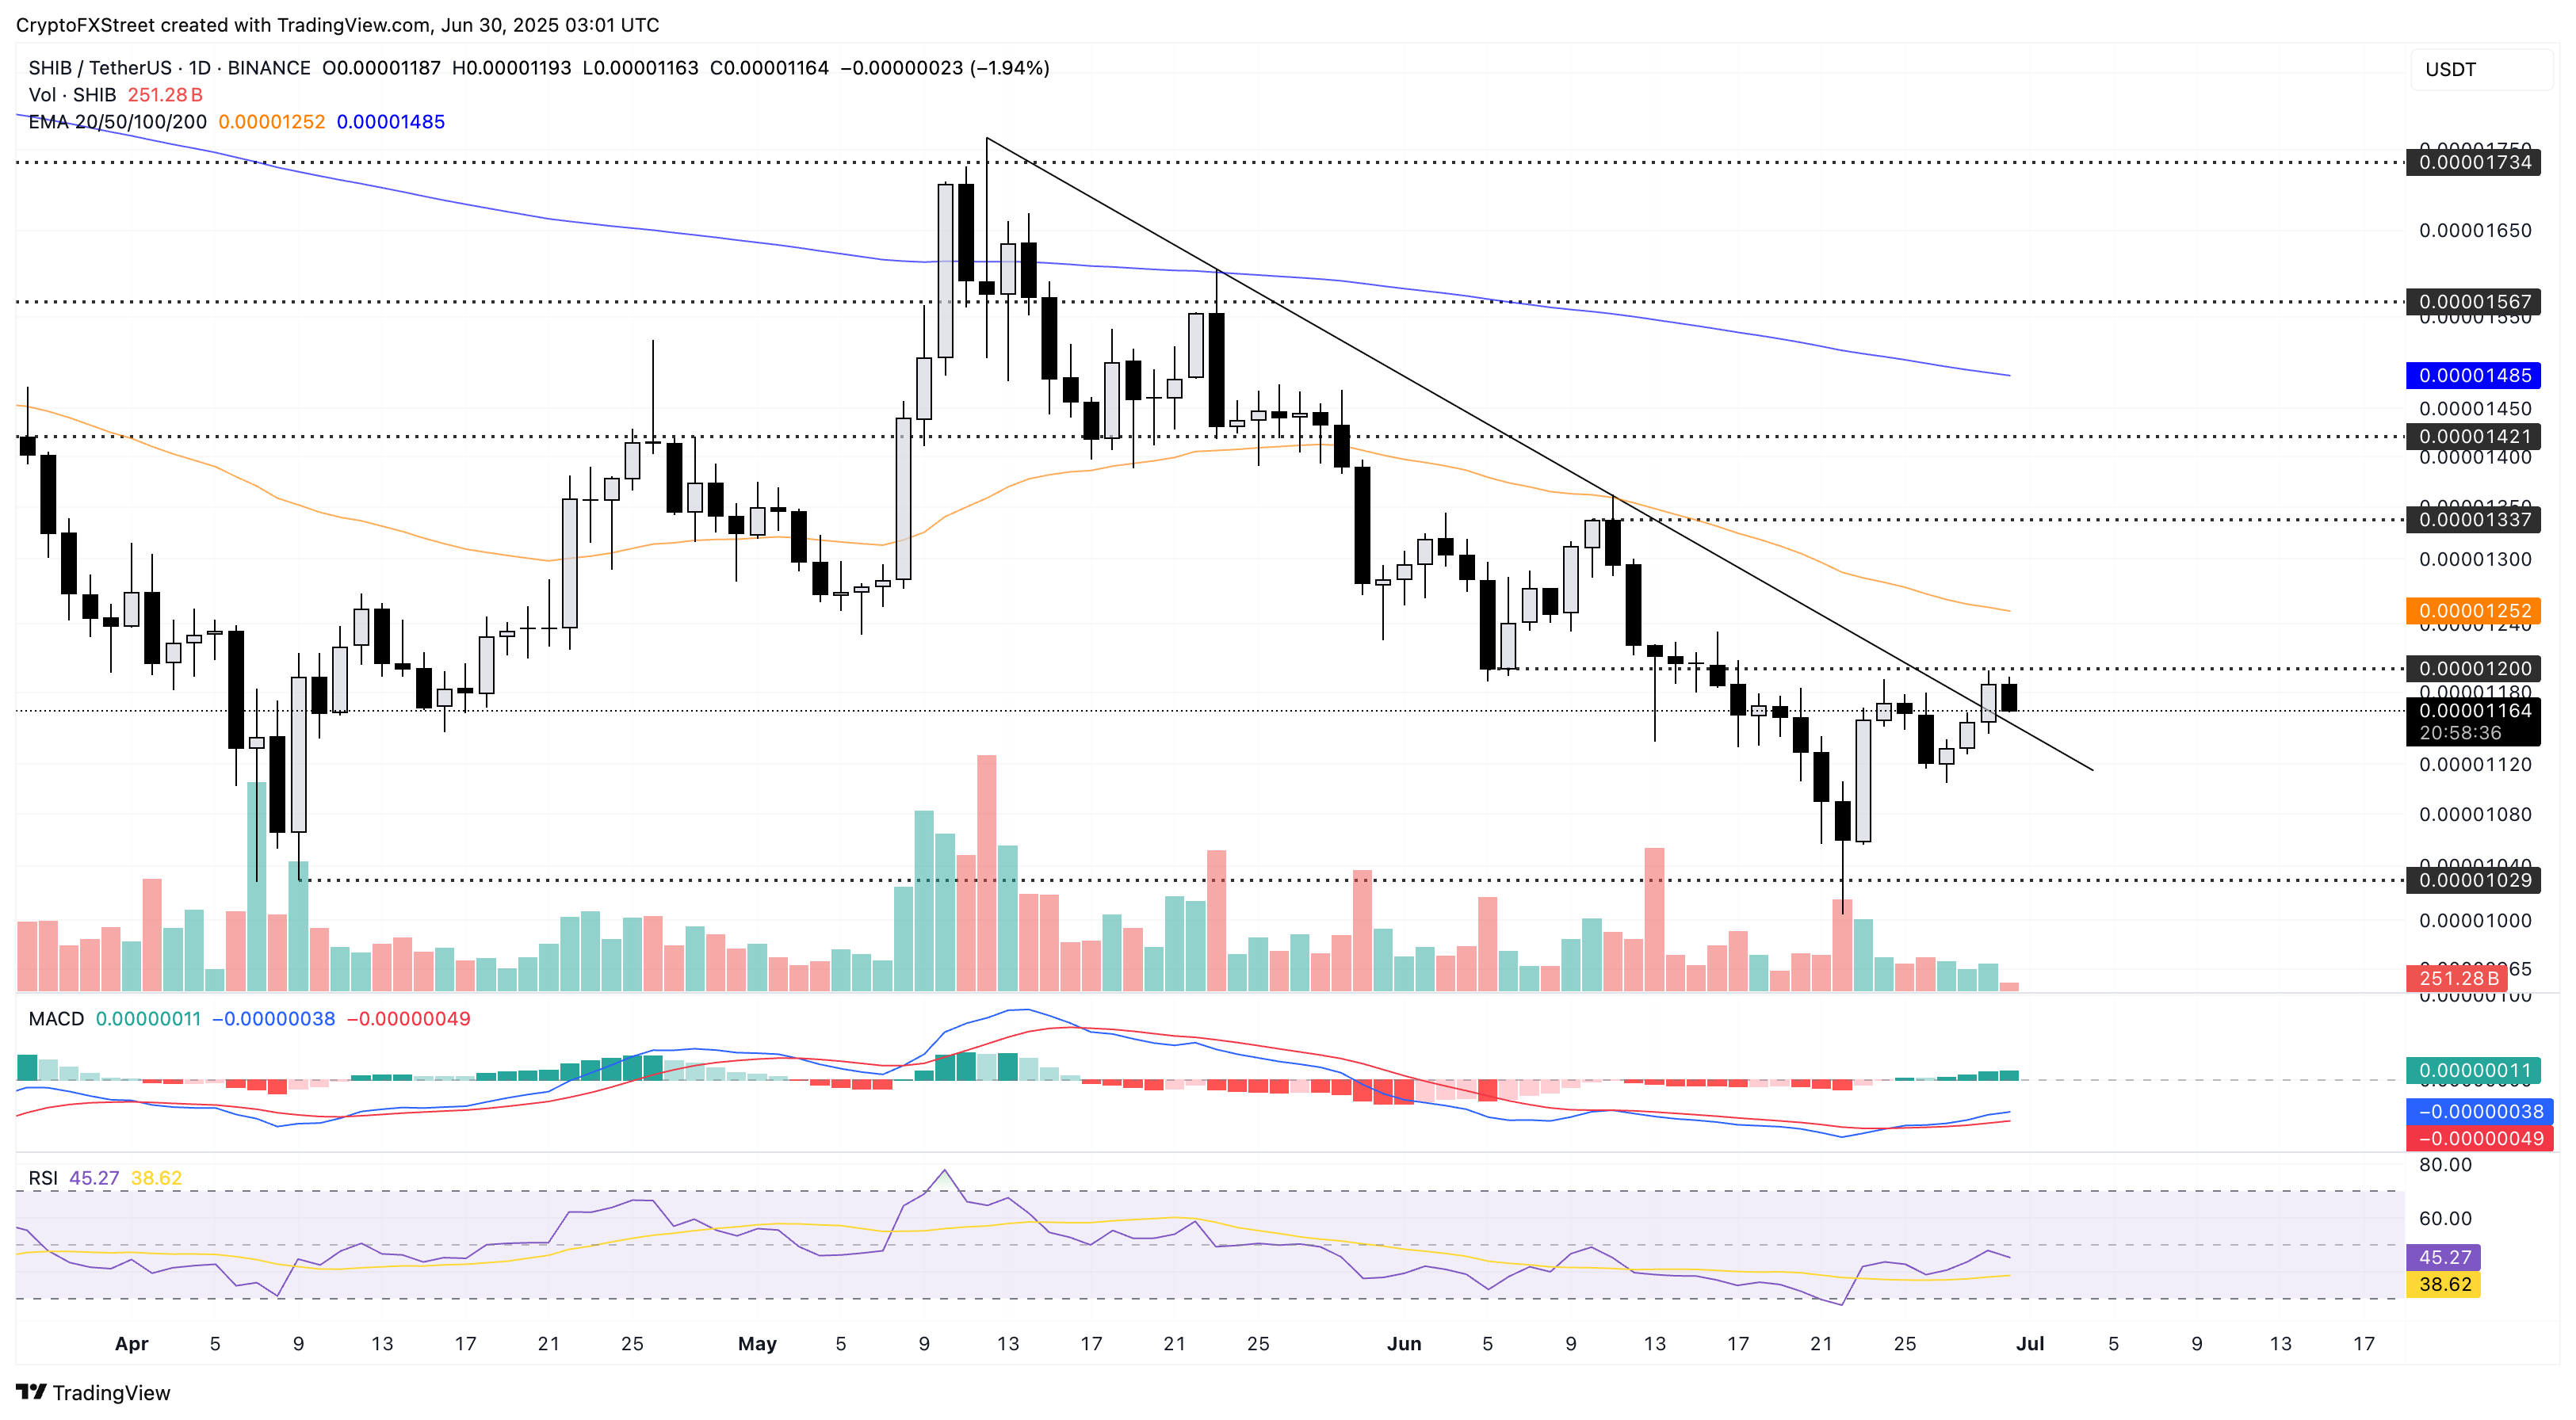
SHIB/USDT daily price chart.
A bearish close below Sunday’s opening price of $0.00001155 would nullify the trendline breakout rally. In such a case, SHIB could target the $0.00001000 psychological support level.
Pepe struggles to overcome a resistance trendline
Pepe ticks lower 2% at press time as the buying pressure softens following the 8.90% jump on Sunday. Despite a 17% return last week, meme coin struggles to overcome a critical resistance trendline marked by the swing highs on May 23 and June 10.
A clear push above the trendline could test the $0.00001196 marked by the lowest price on May 17.
The MACD indicator triggers a trend reversal with the MACD line crossing above its signal line on Sunday. The RSI is at 46 inches closer to the midpoint, indicating a neutral playfield as the bearish pressure declines.
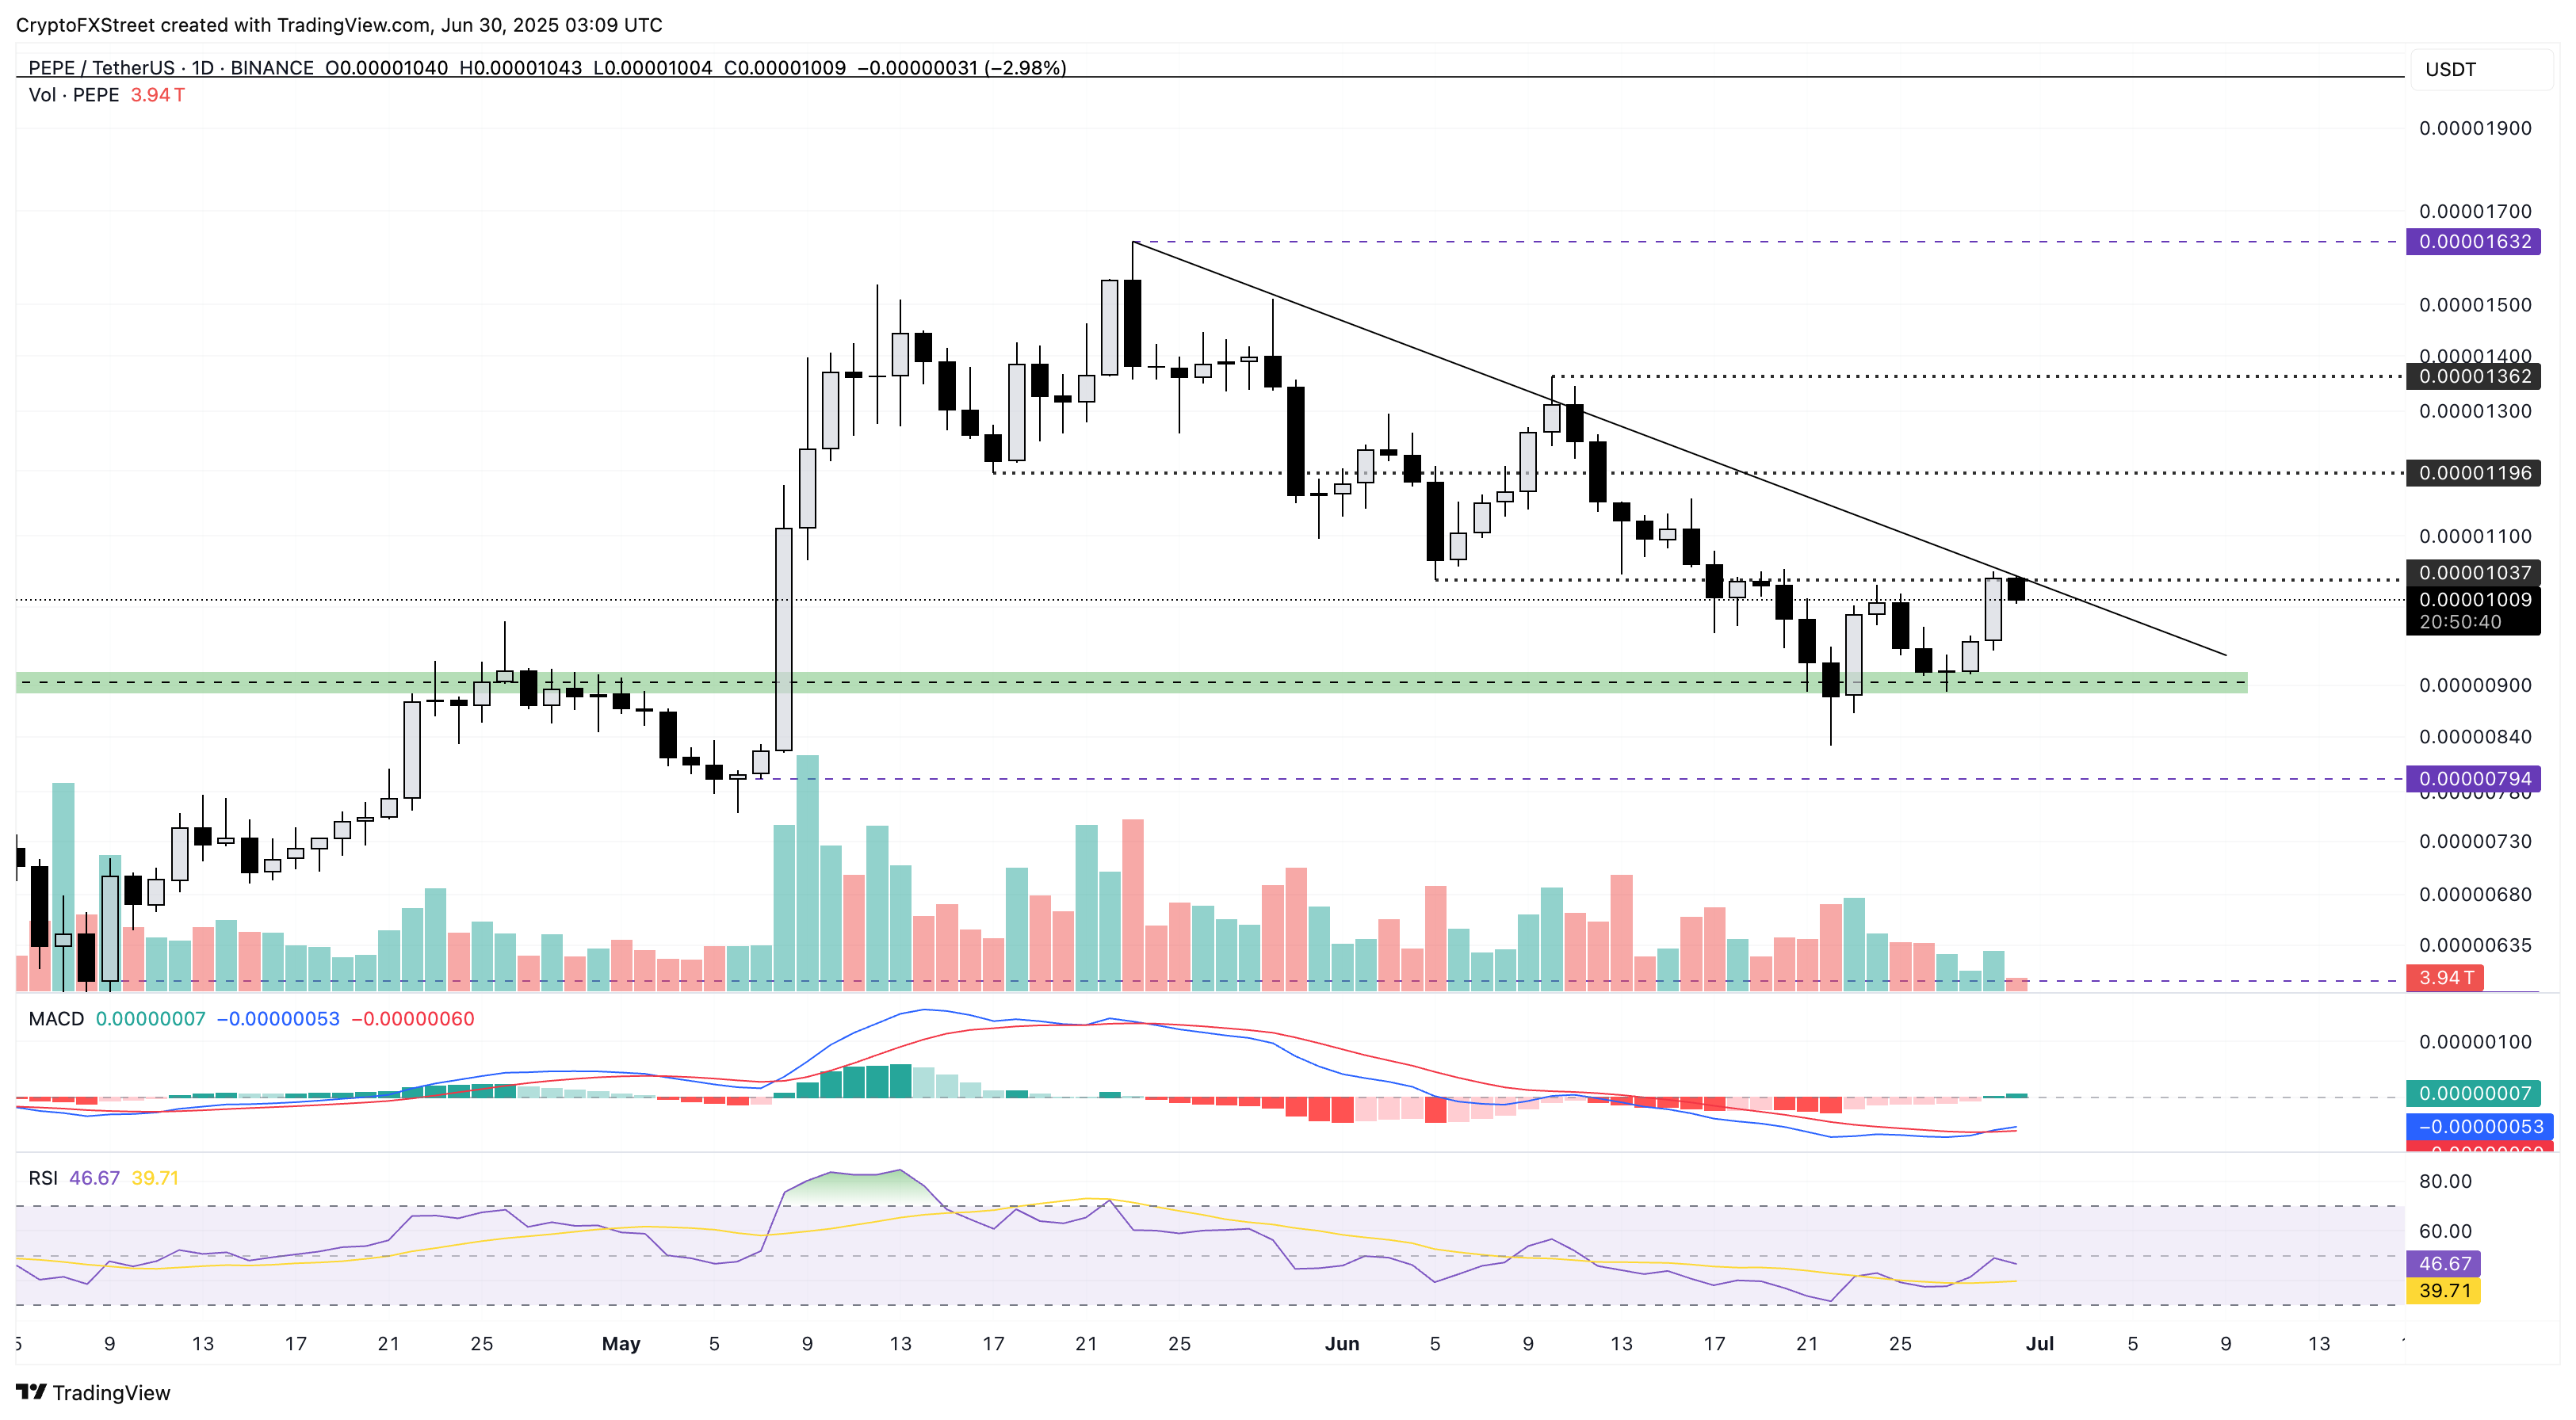
PEPE/USDT daily price chart.
However, a negative close could retest the $0.00000900 support zone last tested on Friday.