


- Crypto markets are up on Monday, fueled by a sudden recovery in Bitcoin.
- Meme coins such as Dogwifhat and SPX6900 lead the rally with double-digit gains.
- The technical outlook of Pepe’s sudden recovery shares a bullish outlook.
Crypto market bounces back as Bitcoin (BTC) reclaims the $106,000 level at press time on Tuesday, resulting in a refreshed rally in top meme coins such as Dogwifhat (WIF) and SPX6900 (SPX), and Pepe (PEPE).
Bitcoin bounces off a support range formed between nearly $103,500 and $104,900 on the 4-hour chart. The breakout rally propels BTC above the 50-period Exponential Moving Average (EMA), challenging the short-term resistance at $106,640.
The momentum indicators suggest a surge in momentum as the Moving Average Convergence/Divergence (MACD) and its signal line approach the centre line after a bullish crossover. Additionally, the Relative Strength Index (RSI) at 56 spikes above the halfway line, flashing a resurgence in buying pressure.
A clean push above $106,640, leading to a 4-hour closing, could test the next key resistance for Bitcoin at $110,422.
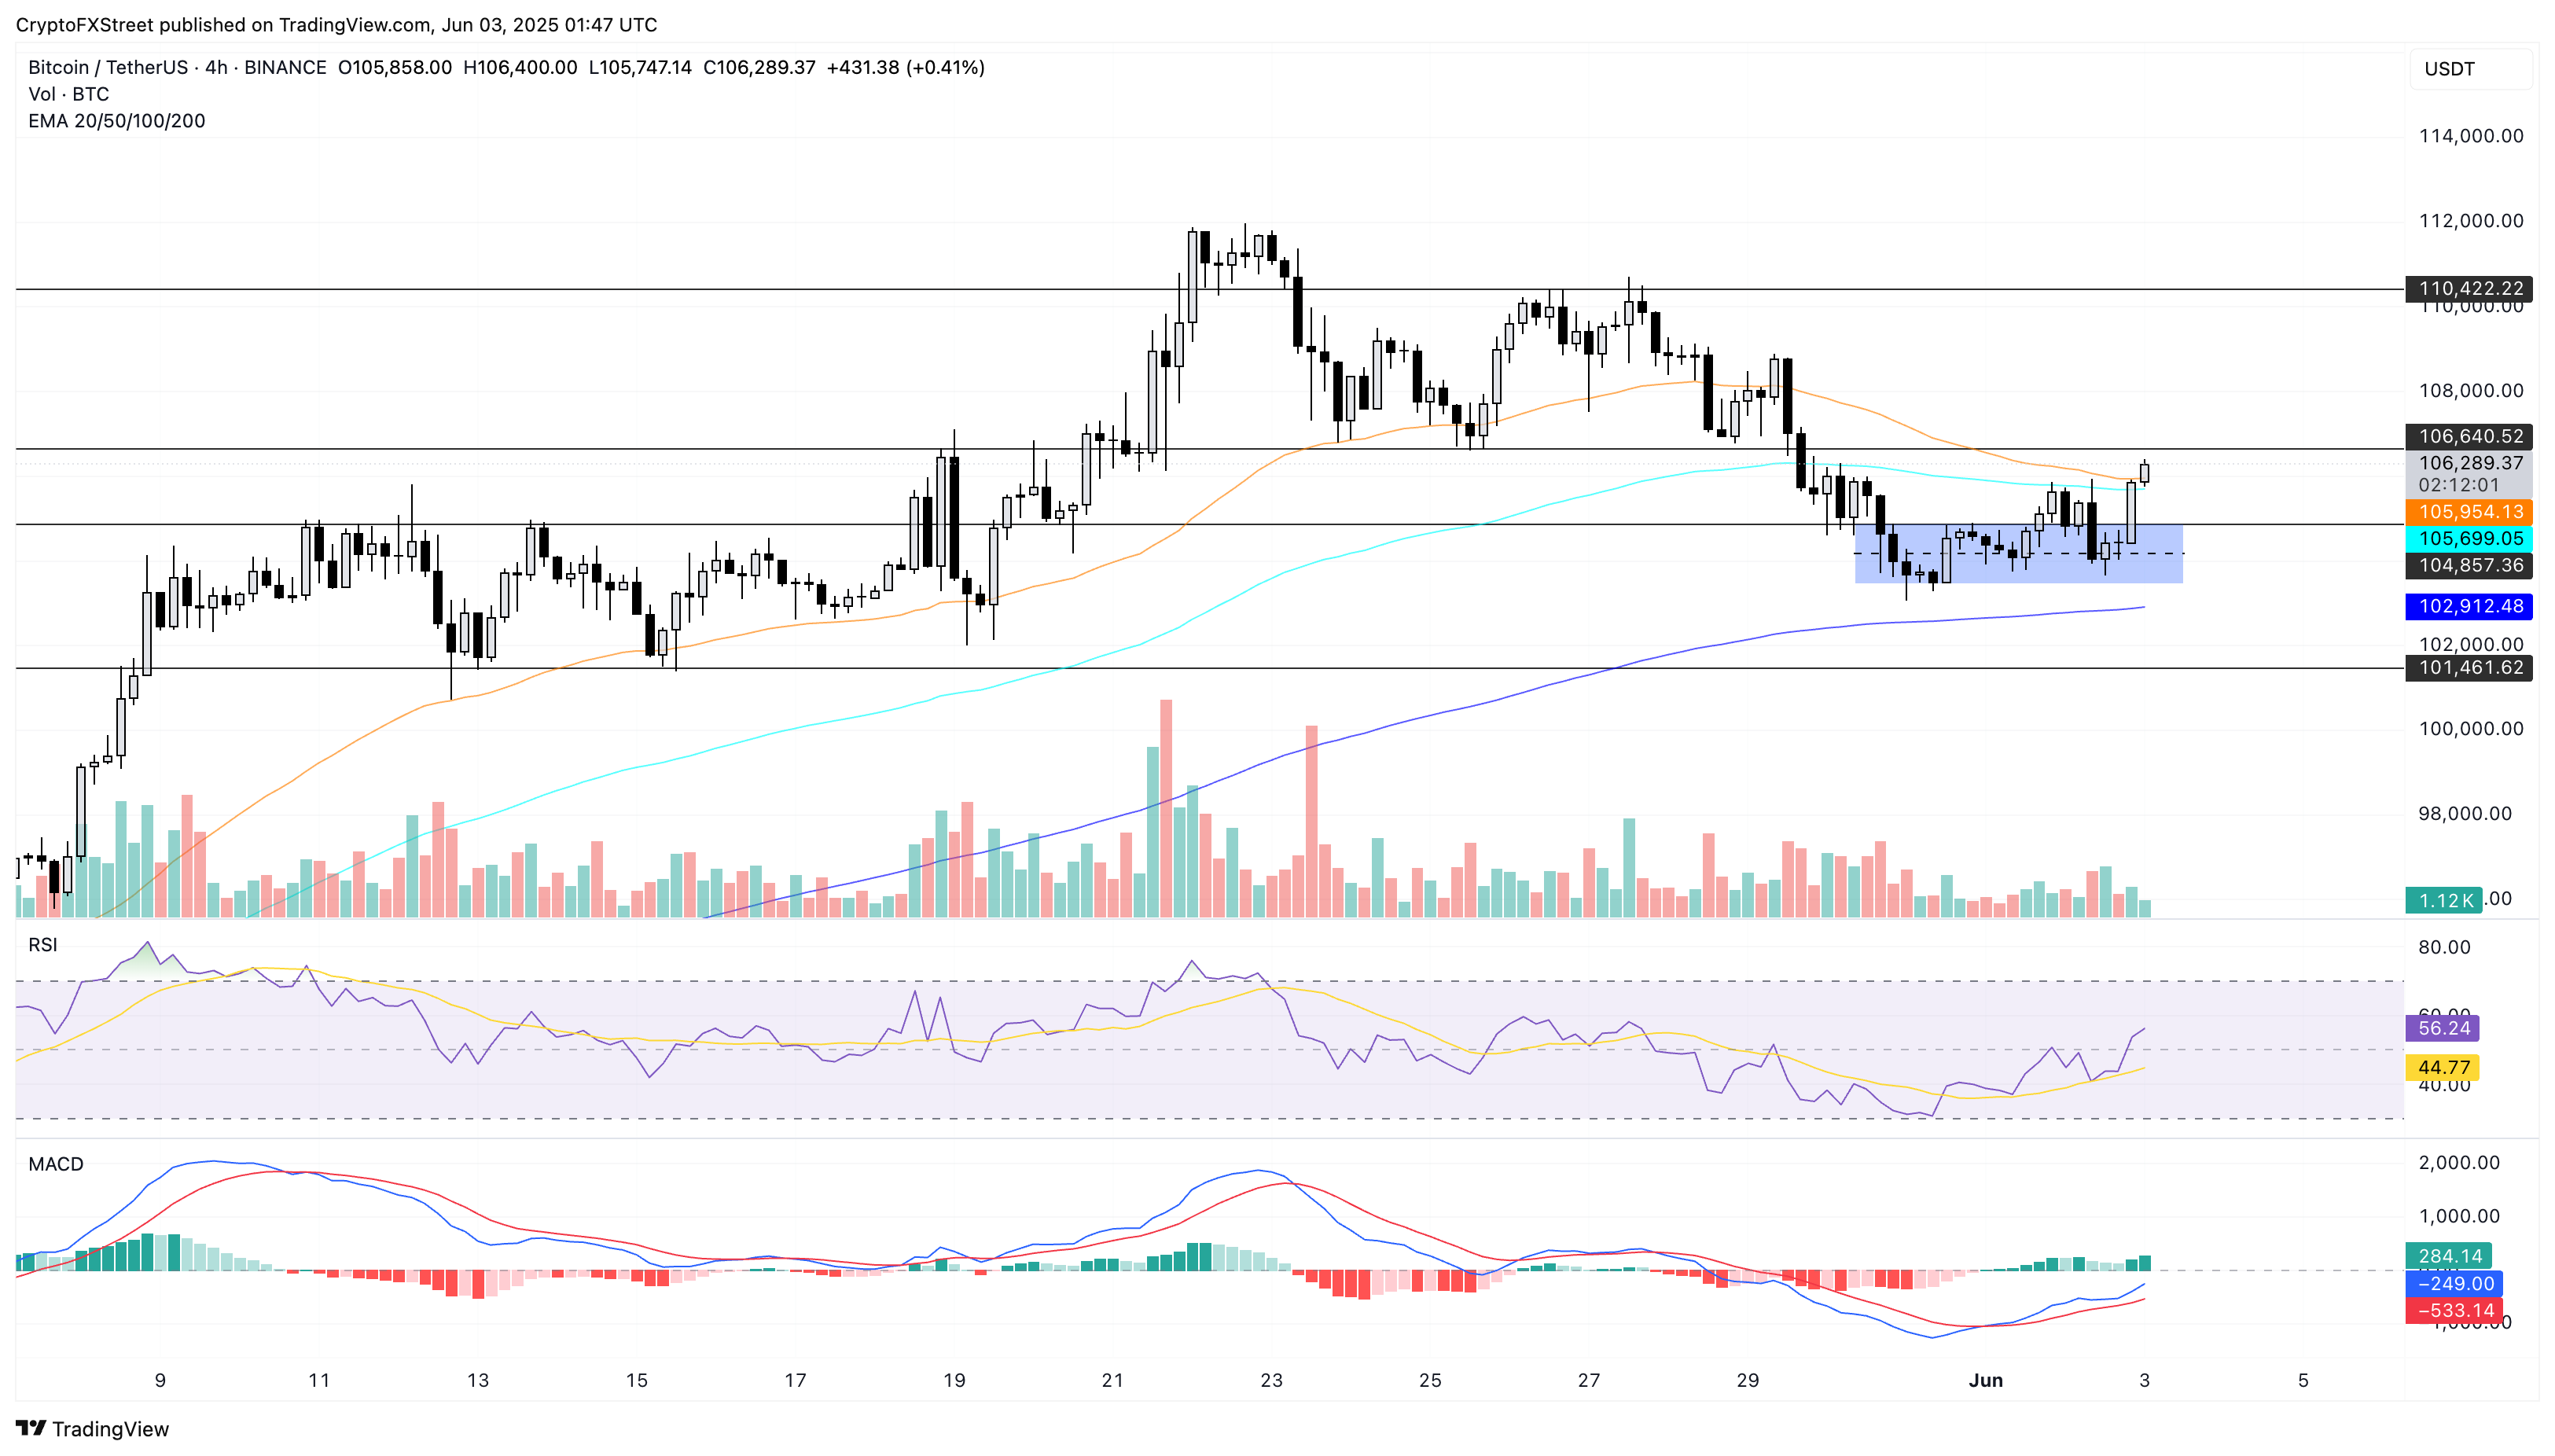
BTC/USDT 4-hour price chart. Source: Tradingview
On the flip side, the previously mentioned demand zone and the 200-period EMA at $102,911 are crucial BTC support levels.
Dogwifhat leads the market rally
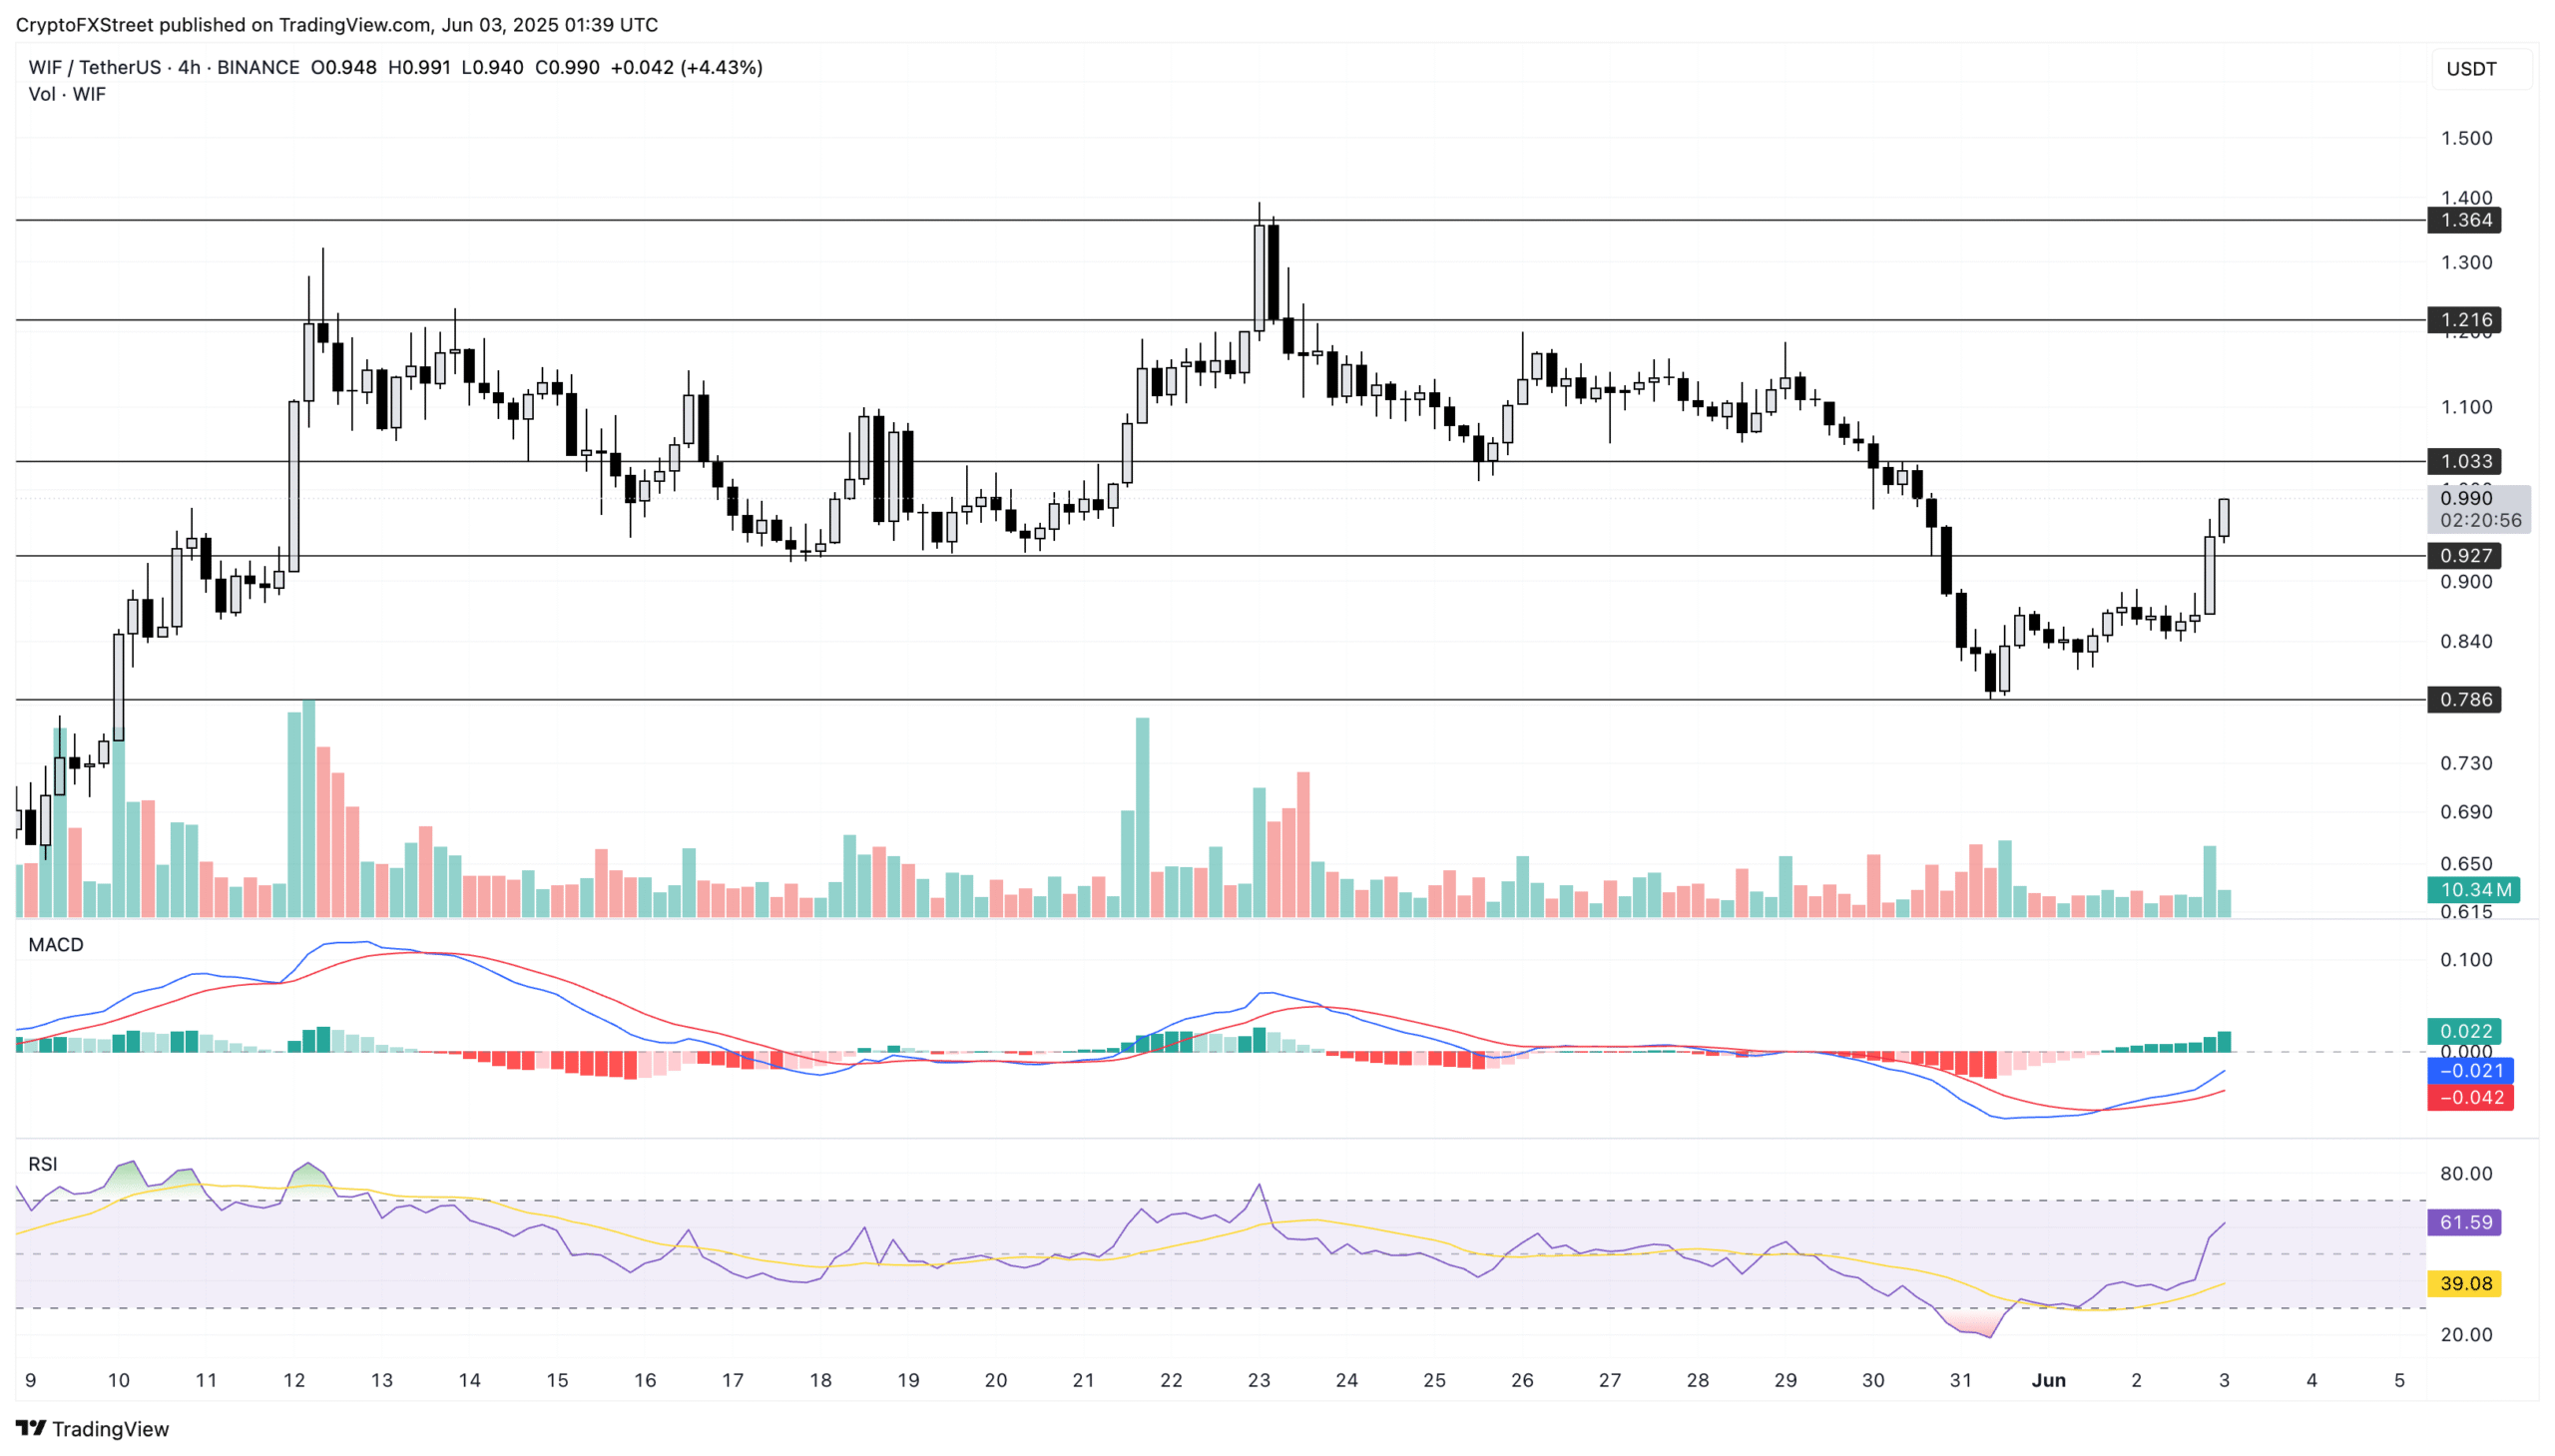
WIF is up over 12% in the last 24 hours at press time on Tuesday, topping the crypto gainers chart. On the 4-hour price chart, the Solana-based meme coin breaks above the $0.927 resistance and trades at $0.990, suggesting an increased likelihood of WIF reclaiming $1.
The momentum indicators heat up, flashing signs of heightened bullish momentum. The MACD and signal lines surge after the recent crossover with a fresh wave of positive histogram bars, suggesting a rise in bullish momentum. The RSI line spiking to 60 flashes a boost in buying pressure and room for growth before reaching the overbought levels.
A 4-hour closing price above the immediate resistance for WIF at $1.033 could lead to a smooth sail to $1.216.
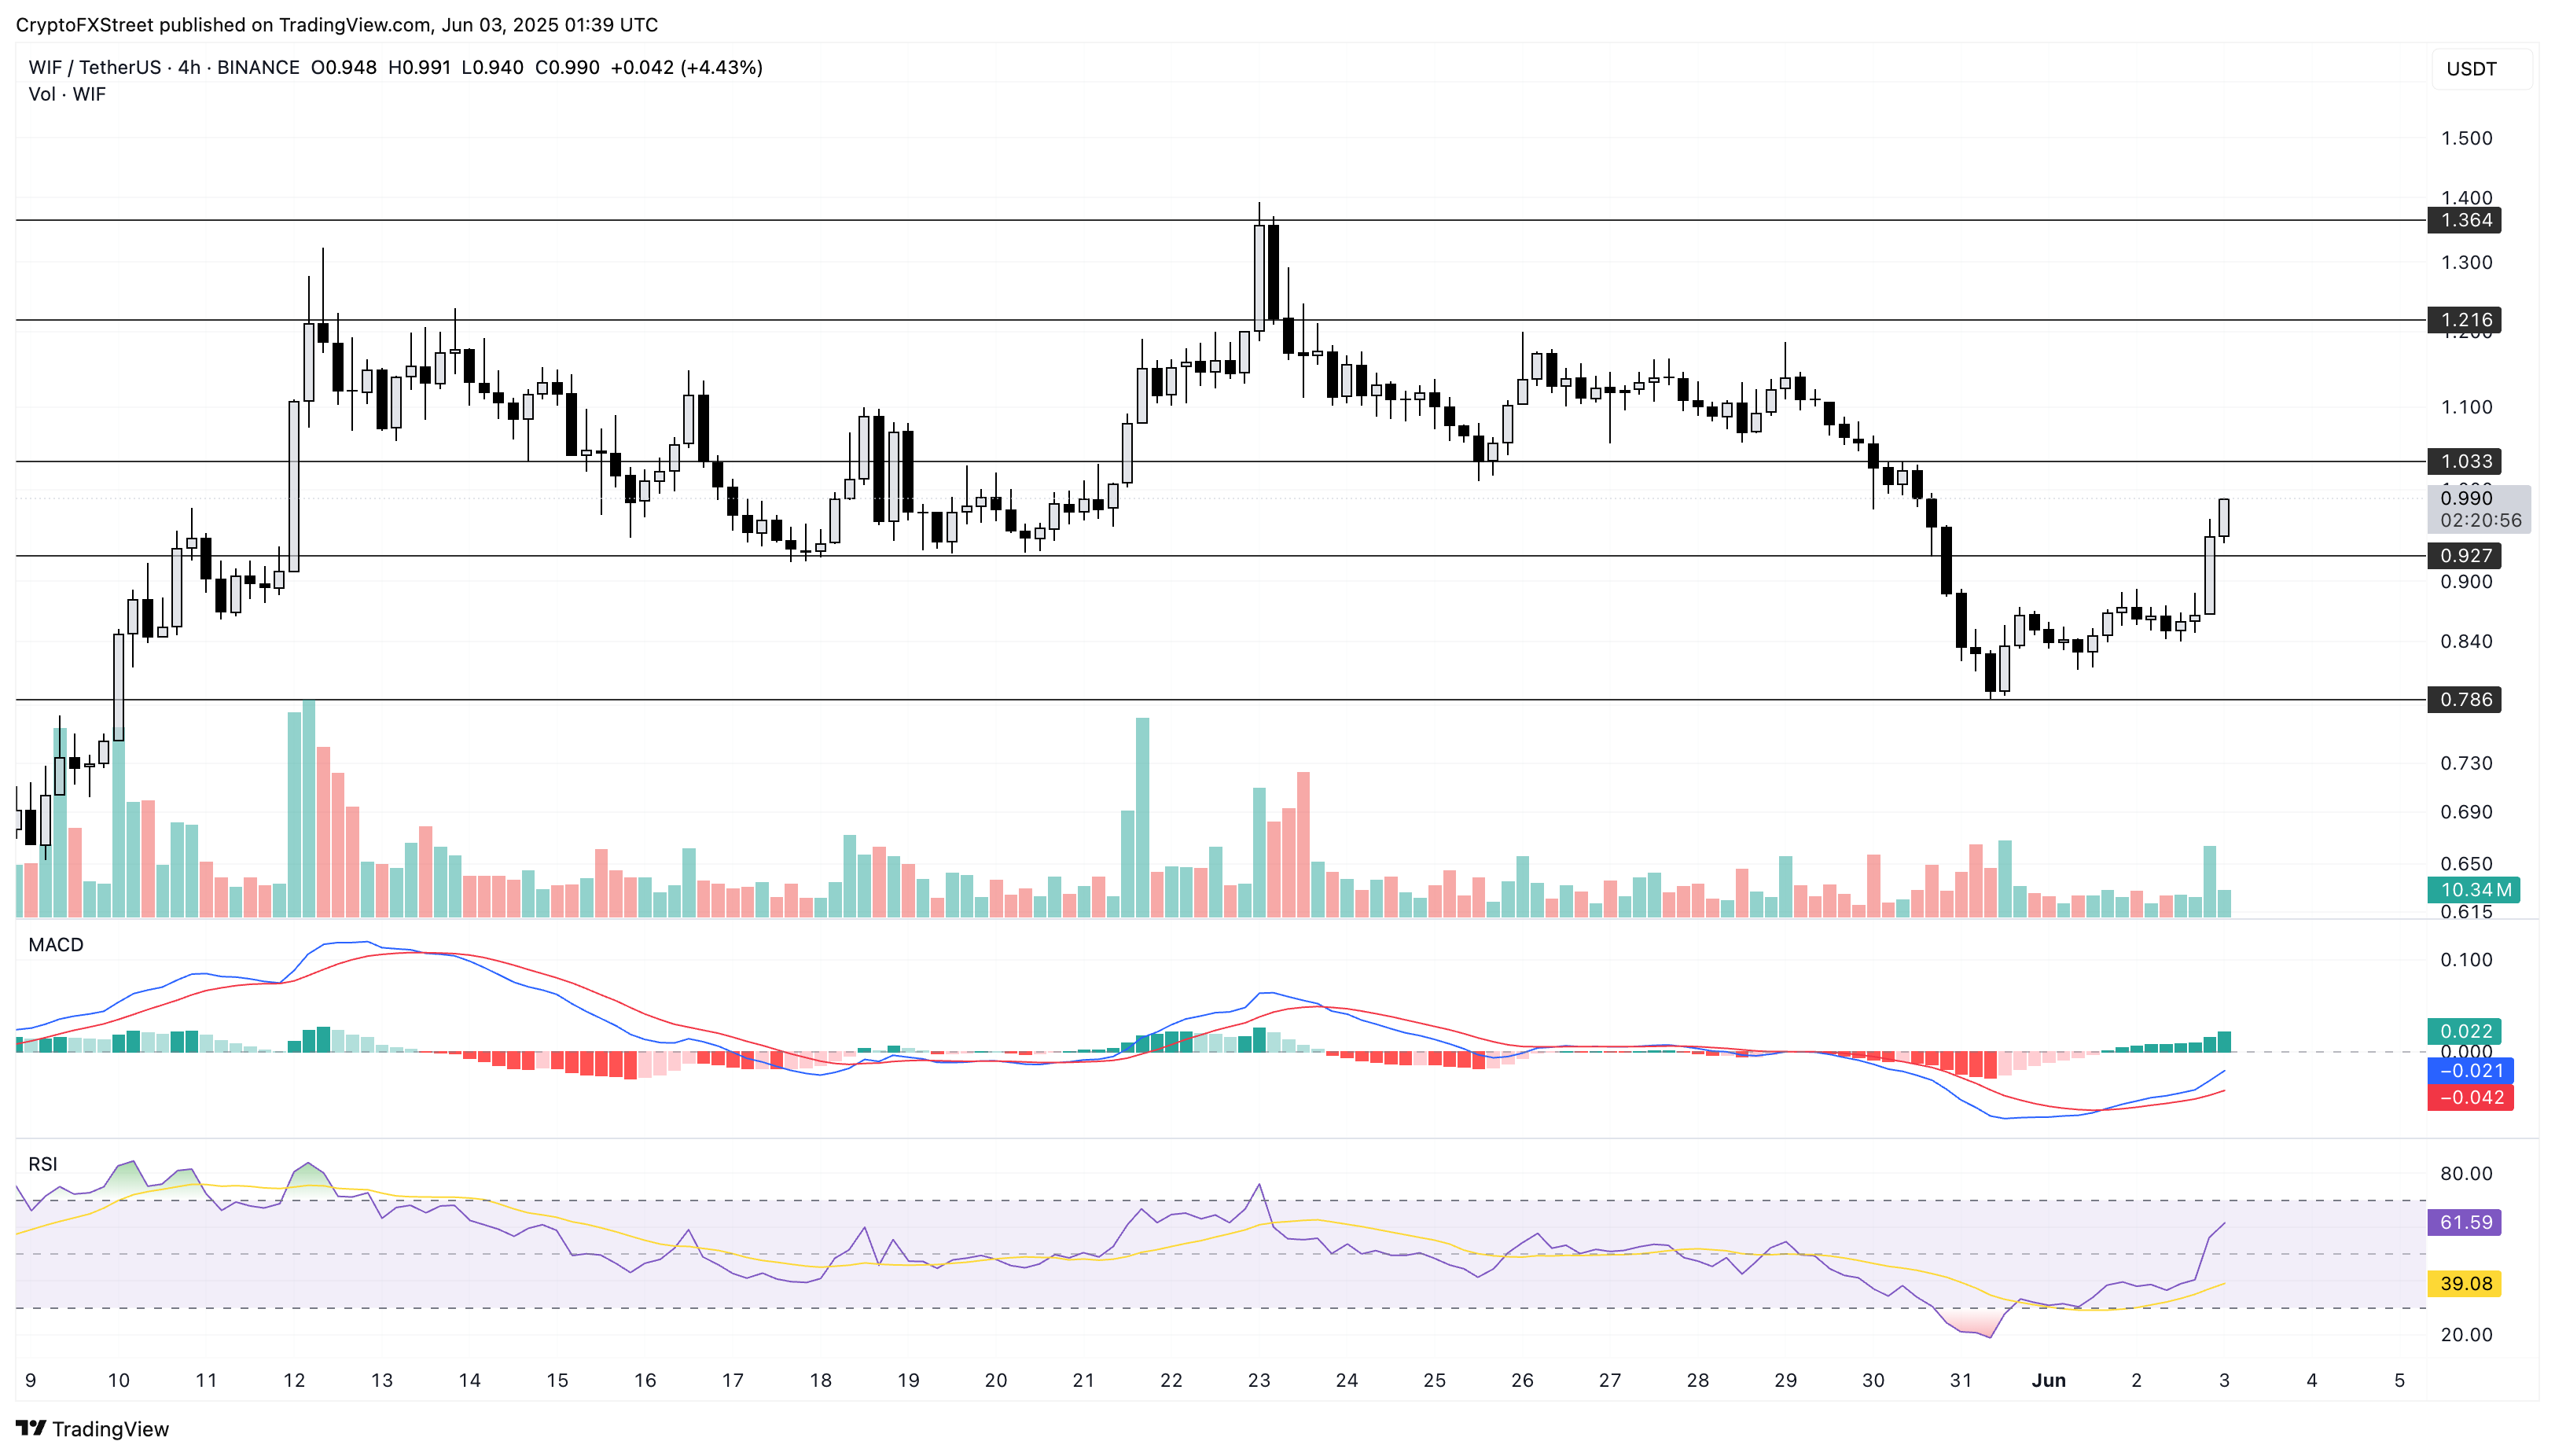
WIF/USDT 4-hour price chart. Source: Tradingview
Conversely, a reversal from $1.033 could test the resistance-turned-support level at $0.927.
SPX meme coin eyes $1.28
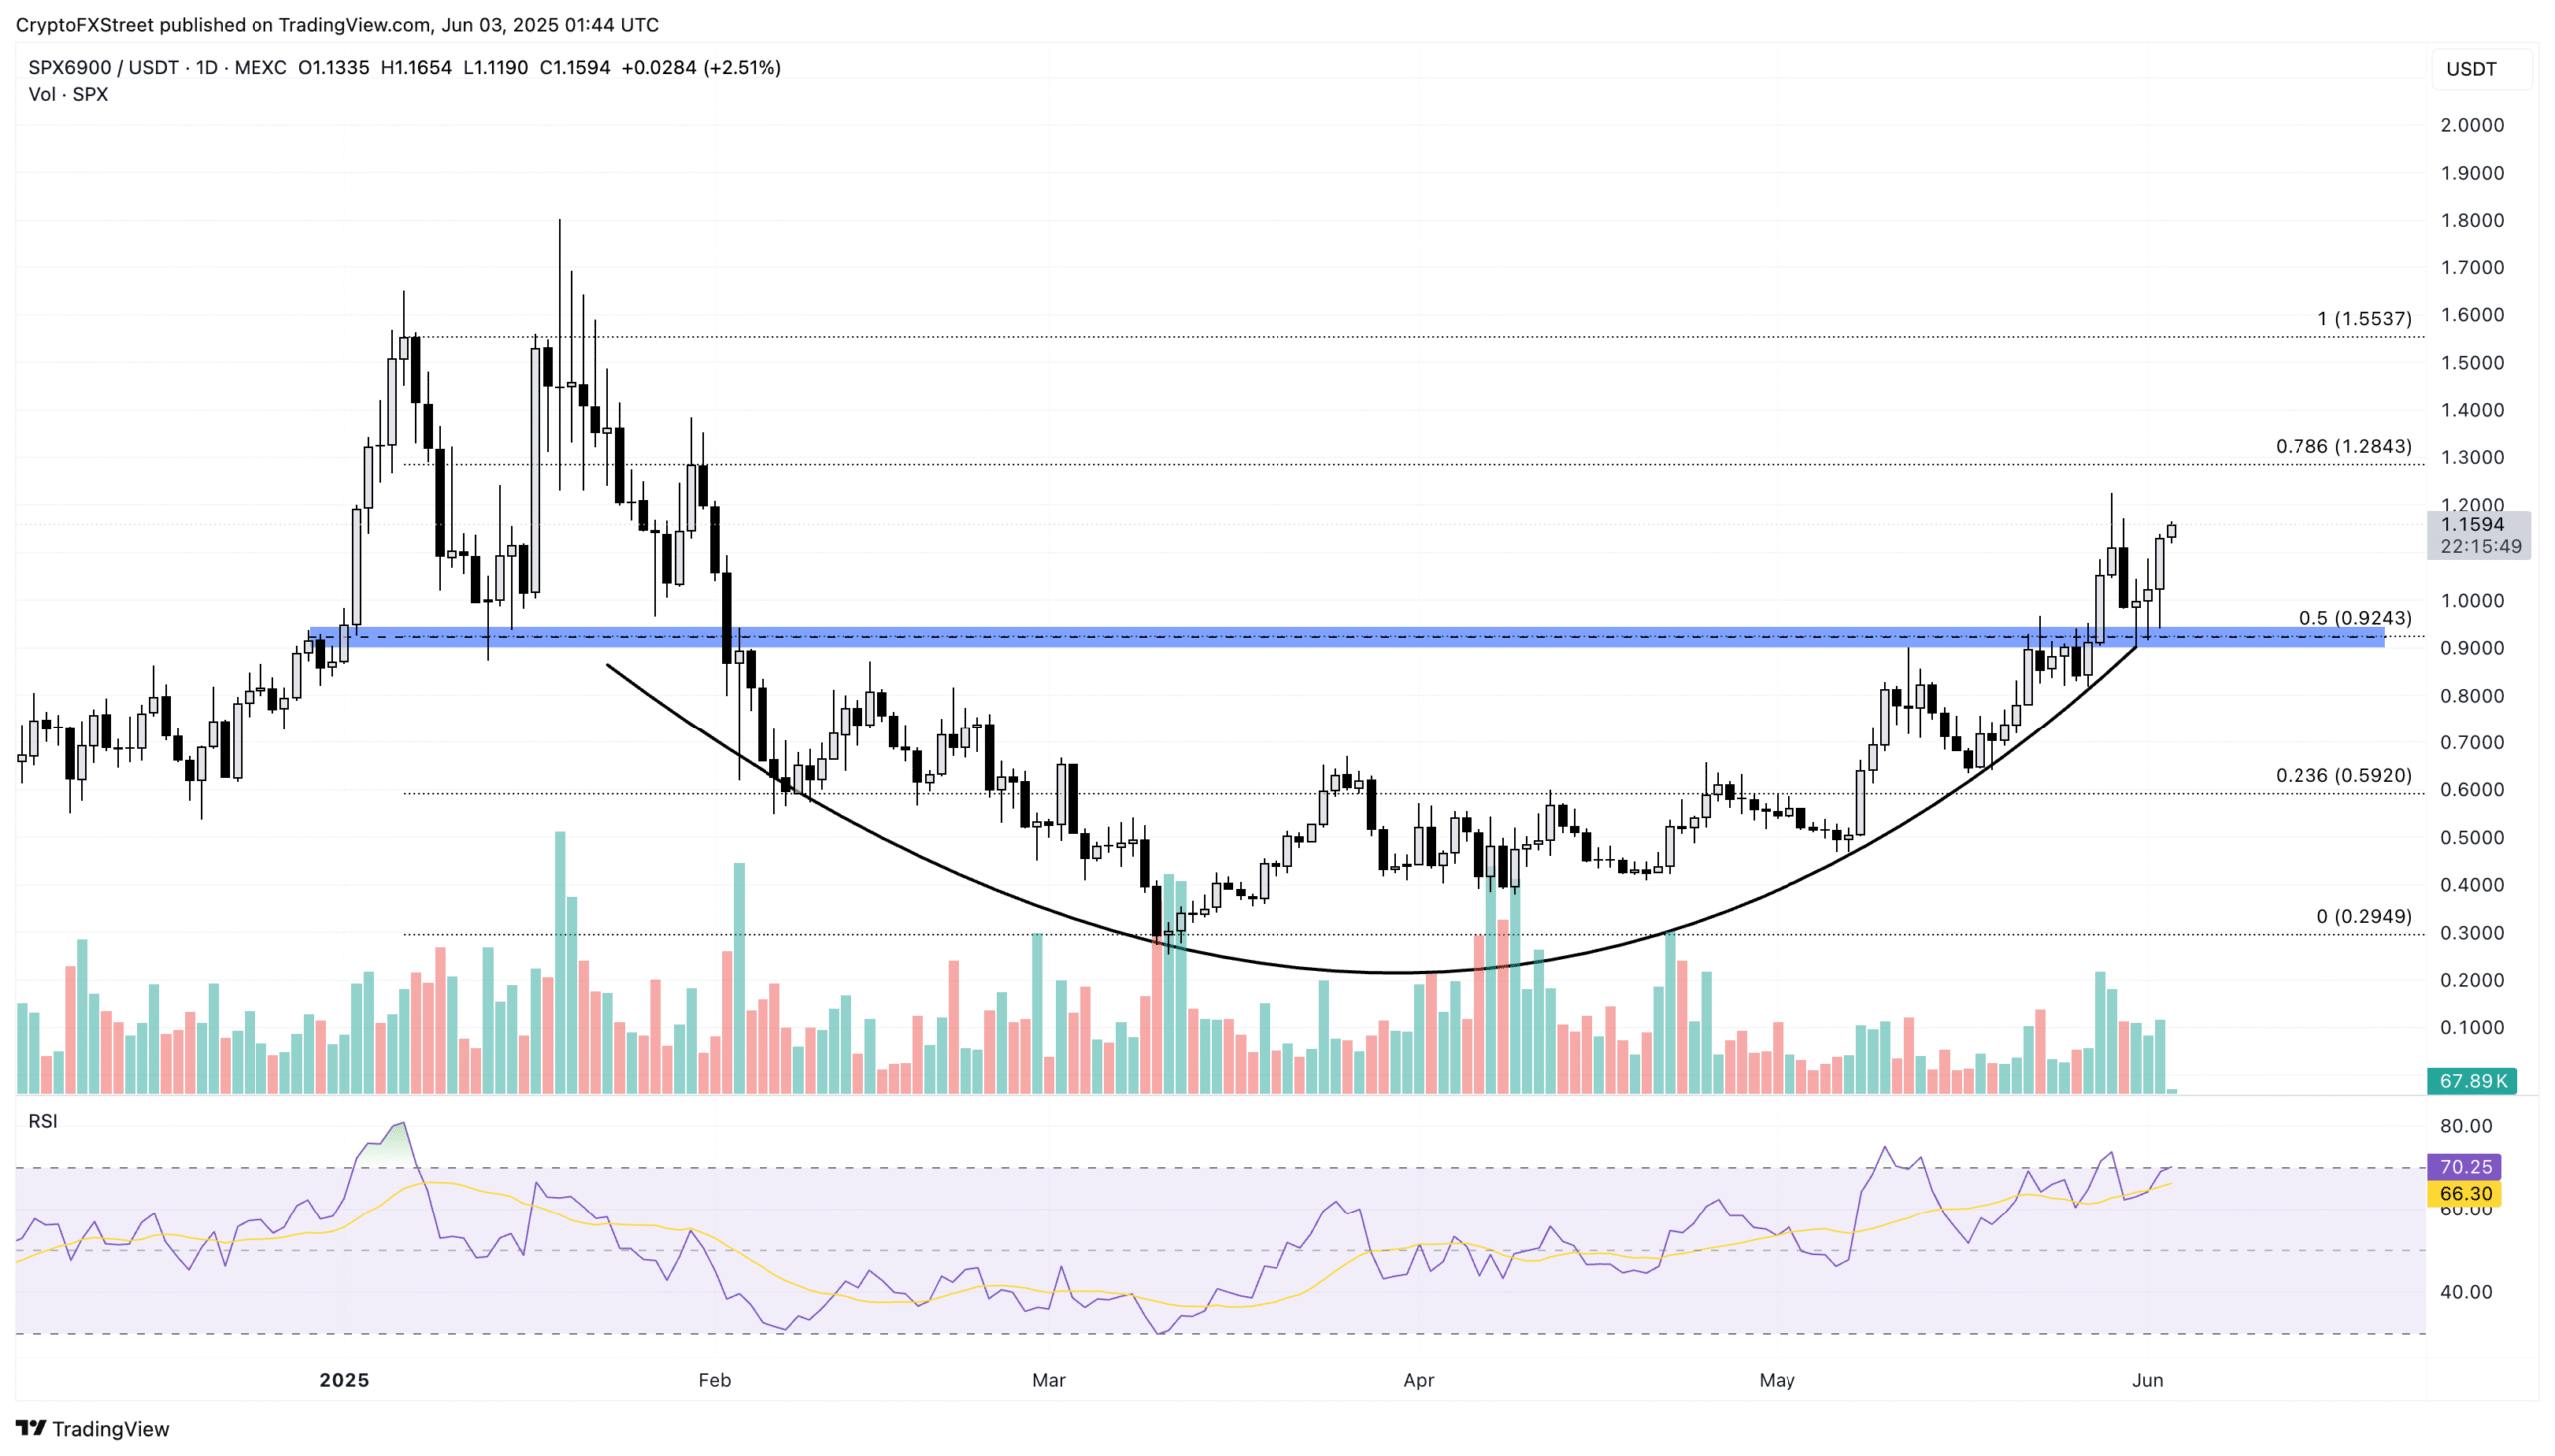
The Solana-based SPX meme coin ends Monday in the green with a 10.47% jump, marking the four-month highest daily close. SPX trades at $1.15 with over 2% gains at press time on Tuesday.
On the daily chart, the price action indicates a post-retest reversal from the broken rounding bottom pattern, with a neckline at 0.92, aligning with the 50% Fibonacci level, extrapolated from $1.55 on January 6 to $0.29 on March 11.
The RSI at 70 hovers continuously near the overbought boundary line, suggesting high bullish momentum. However, investors must remain cautious, as it warns of overbought conditions that could lead to potential reversals.
The 78.6% Fibonacci level at $1.28 is the immediate resistance for SPX6900.
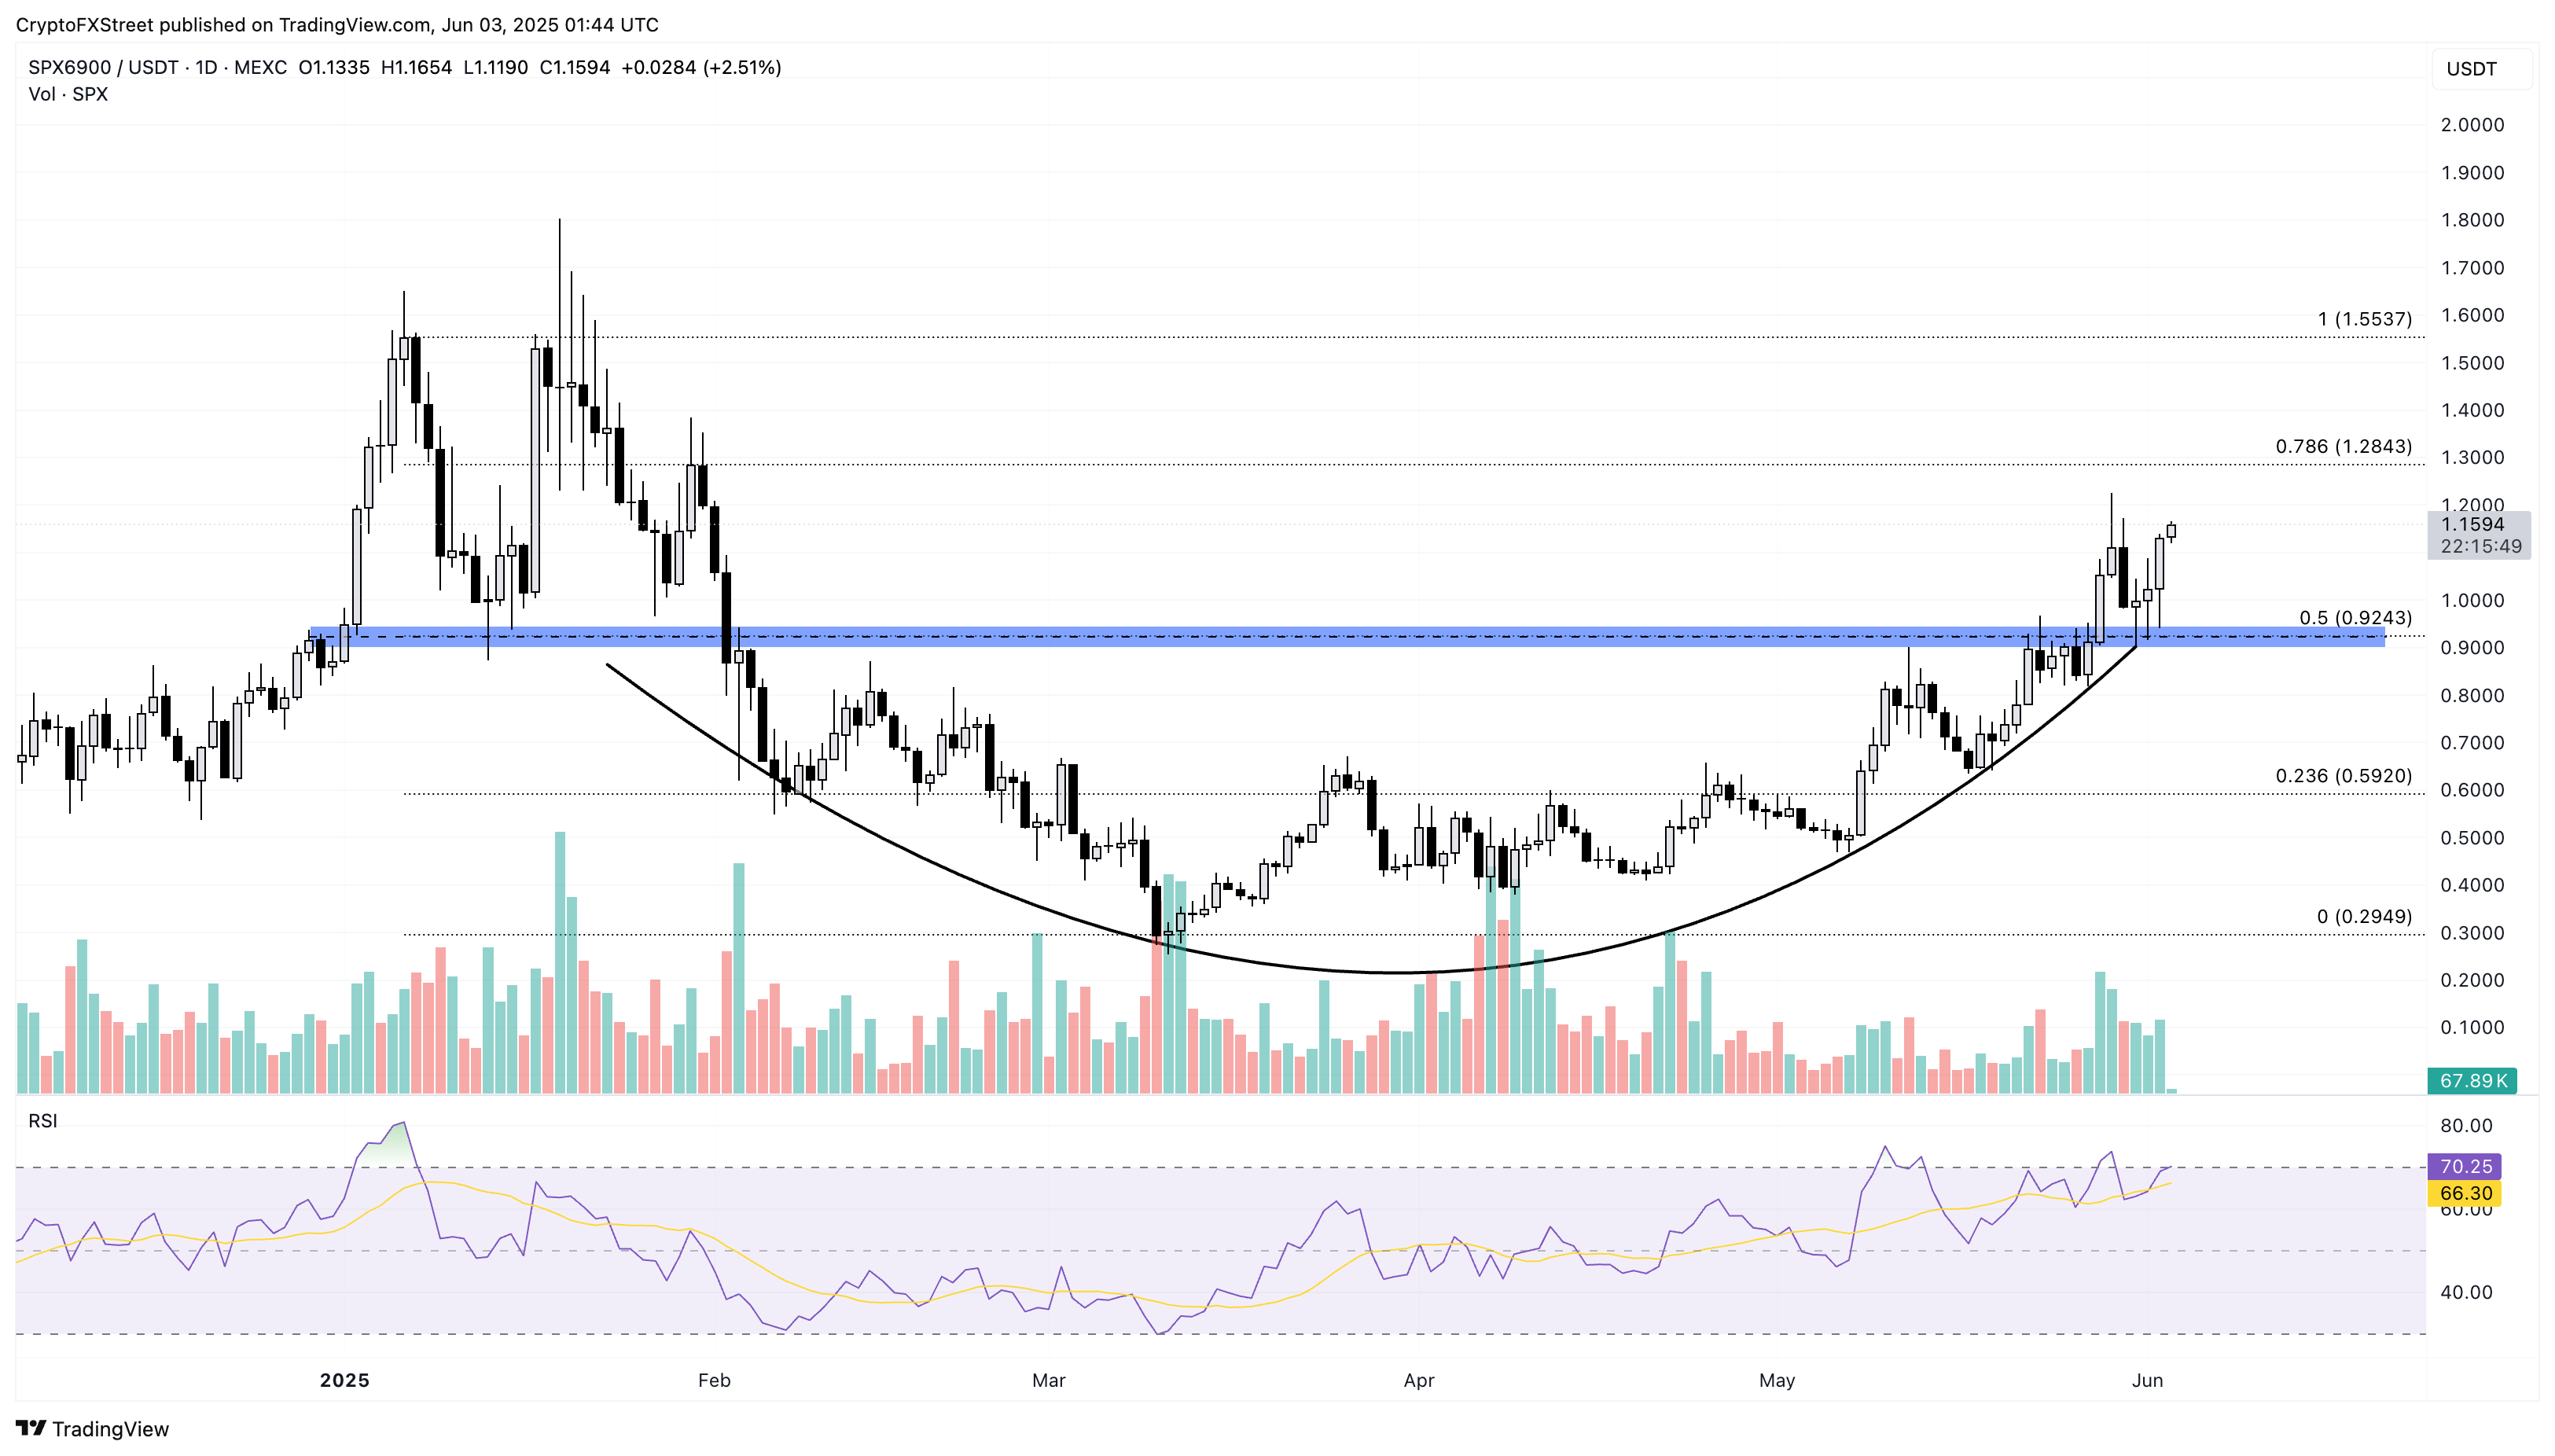
SPX/USDT daily price chart. Source: Tradingview
On the flip side, the $0.92 level remains a crucial support in case of a sudden reversal.
PEPE reversal rally puts $0.00001481 on bullish radar
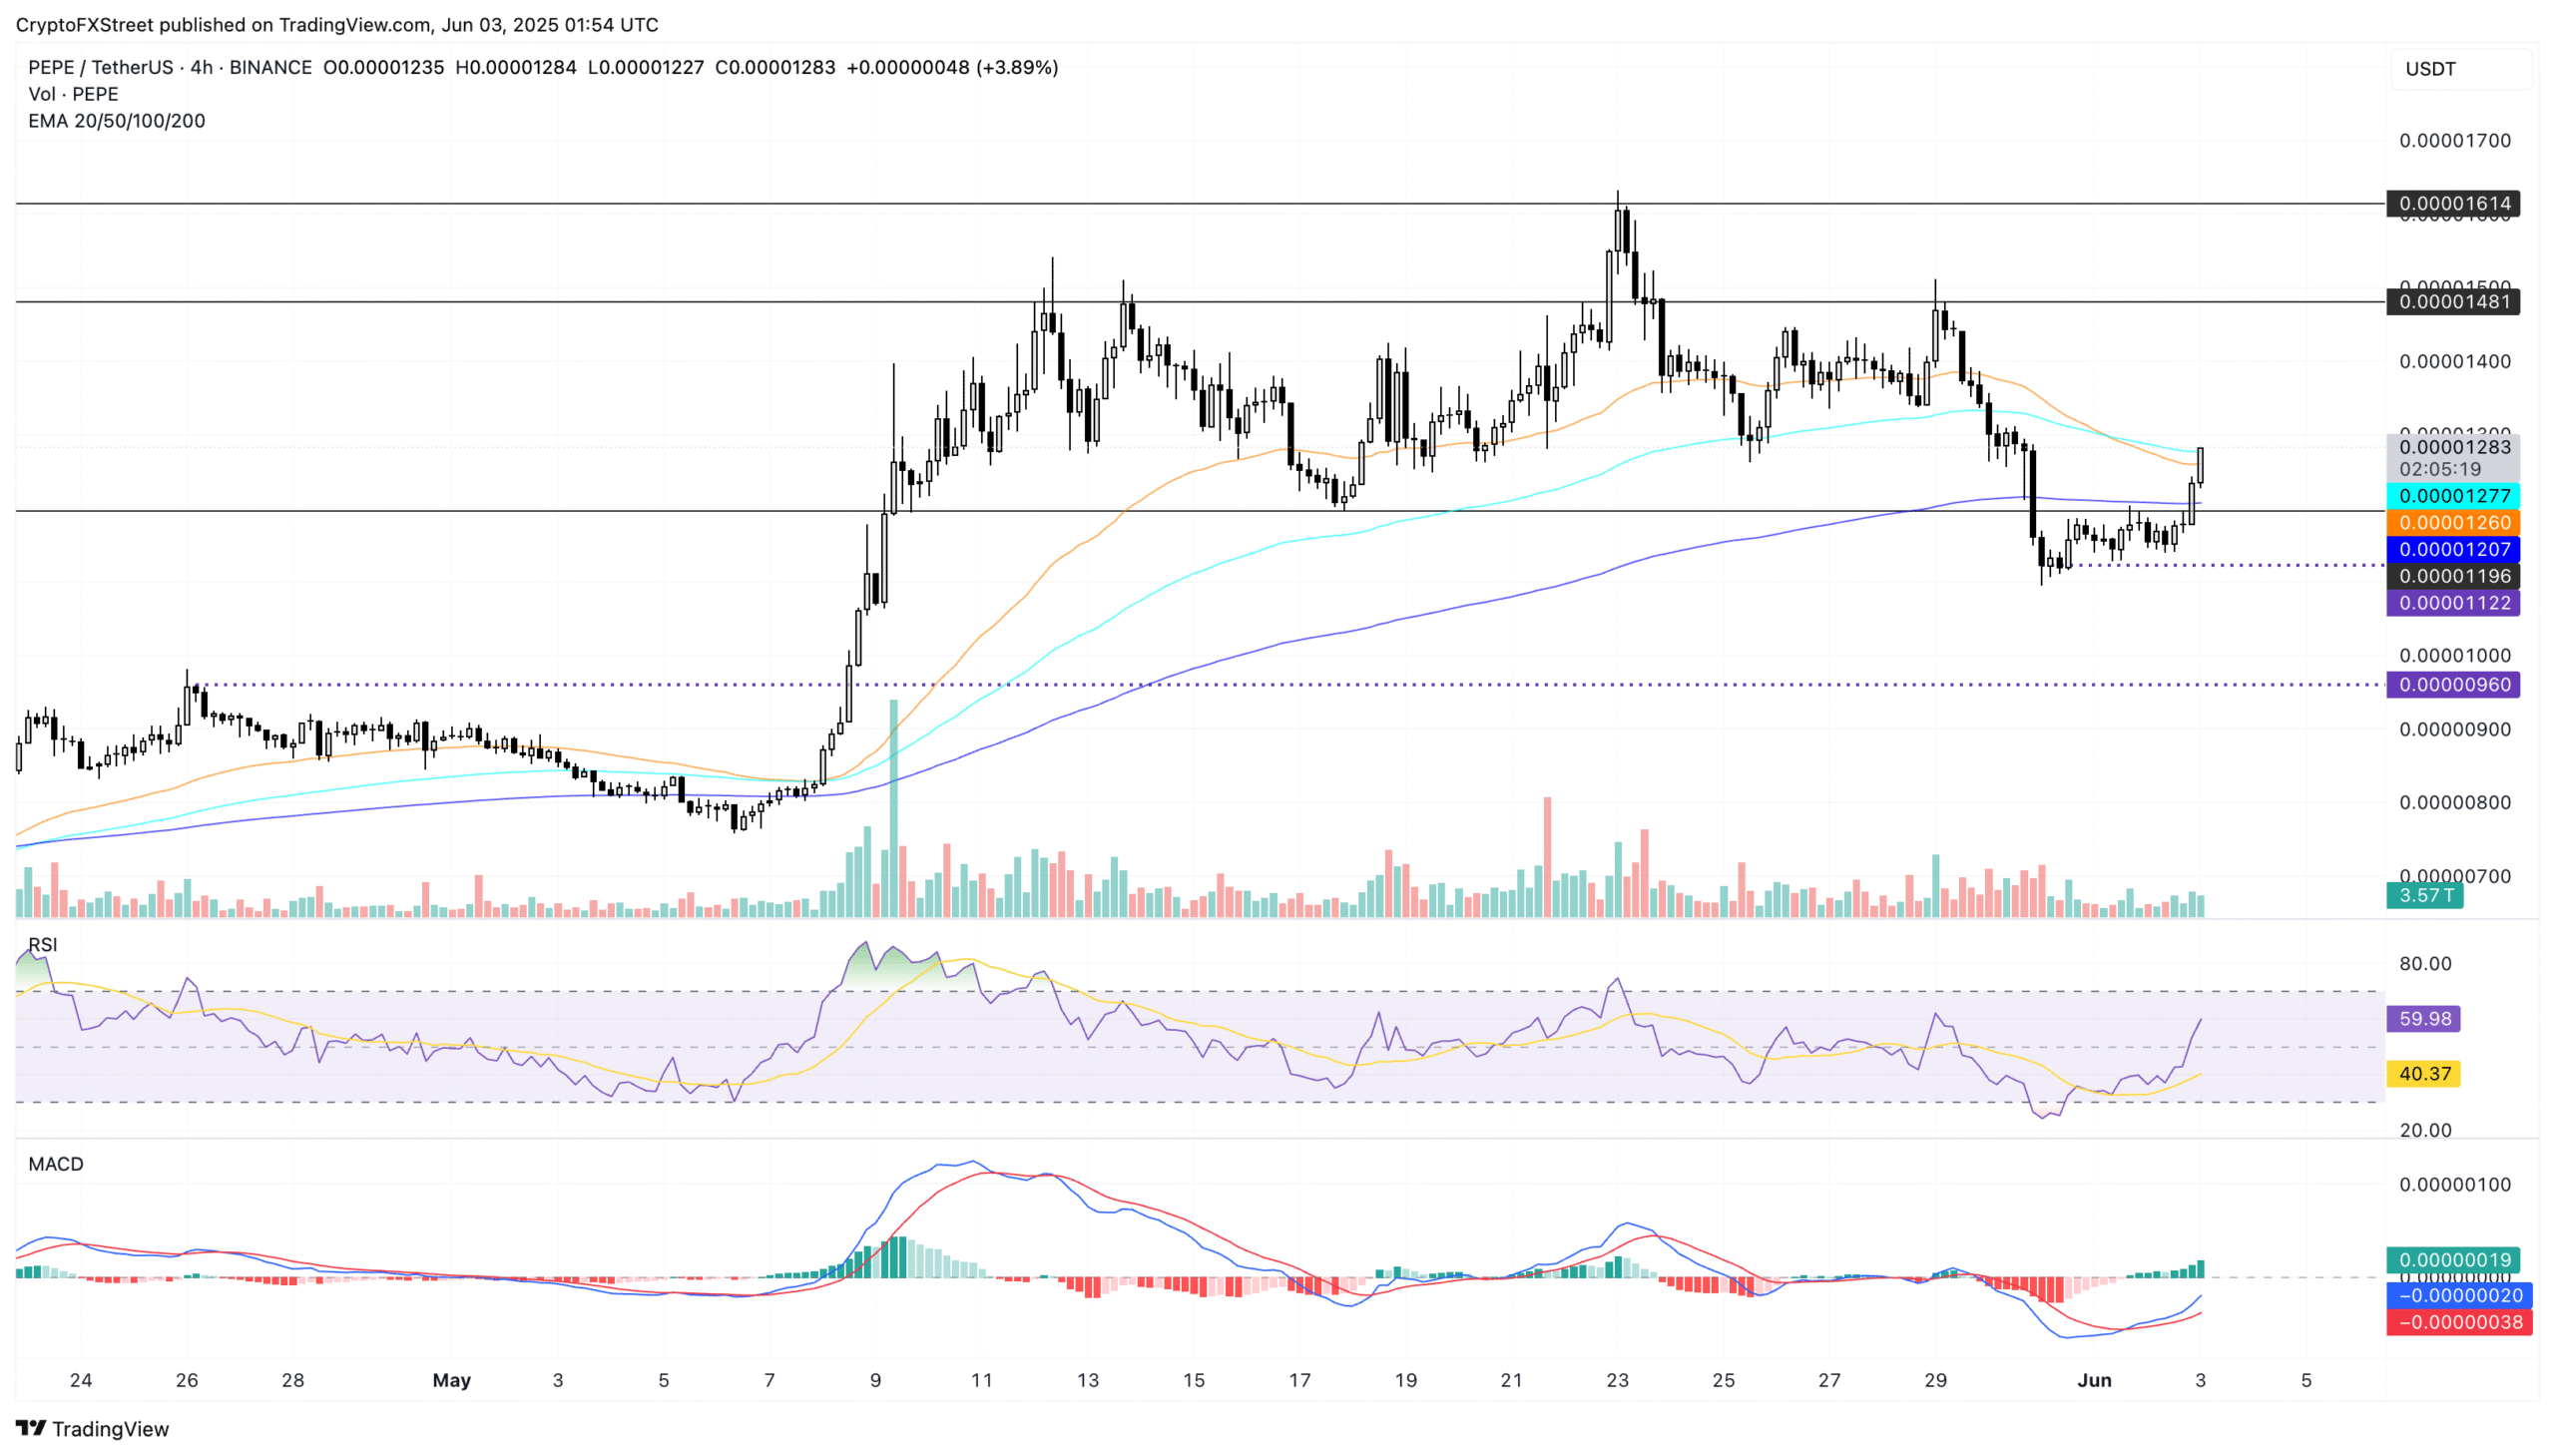
The frog-themed meme coin, PEPE, is back among top performers with a near 9% surge in the last 24 hours at the time of writing. PEPE trades at $0.00001283, bouncing back from the $0.00001122 bottom formed on Saturday.
The meme coin shows a price surge above the 100-period EMA at $0.00001277 alongside a spike in momentum indicators. The MACD and its signal line shoot up towards the centre line, and the RSI hits almost 60, signaling a boost in bullish momentum.
The immediate resistance for PEPE is the $0.00001481 level, reflecting moderate upside gains if the momentum holds.
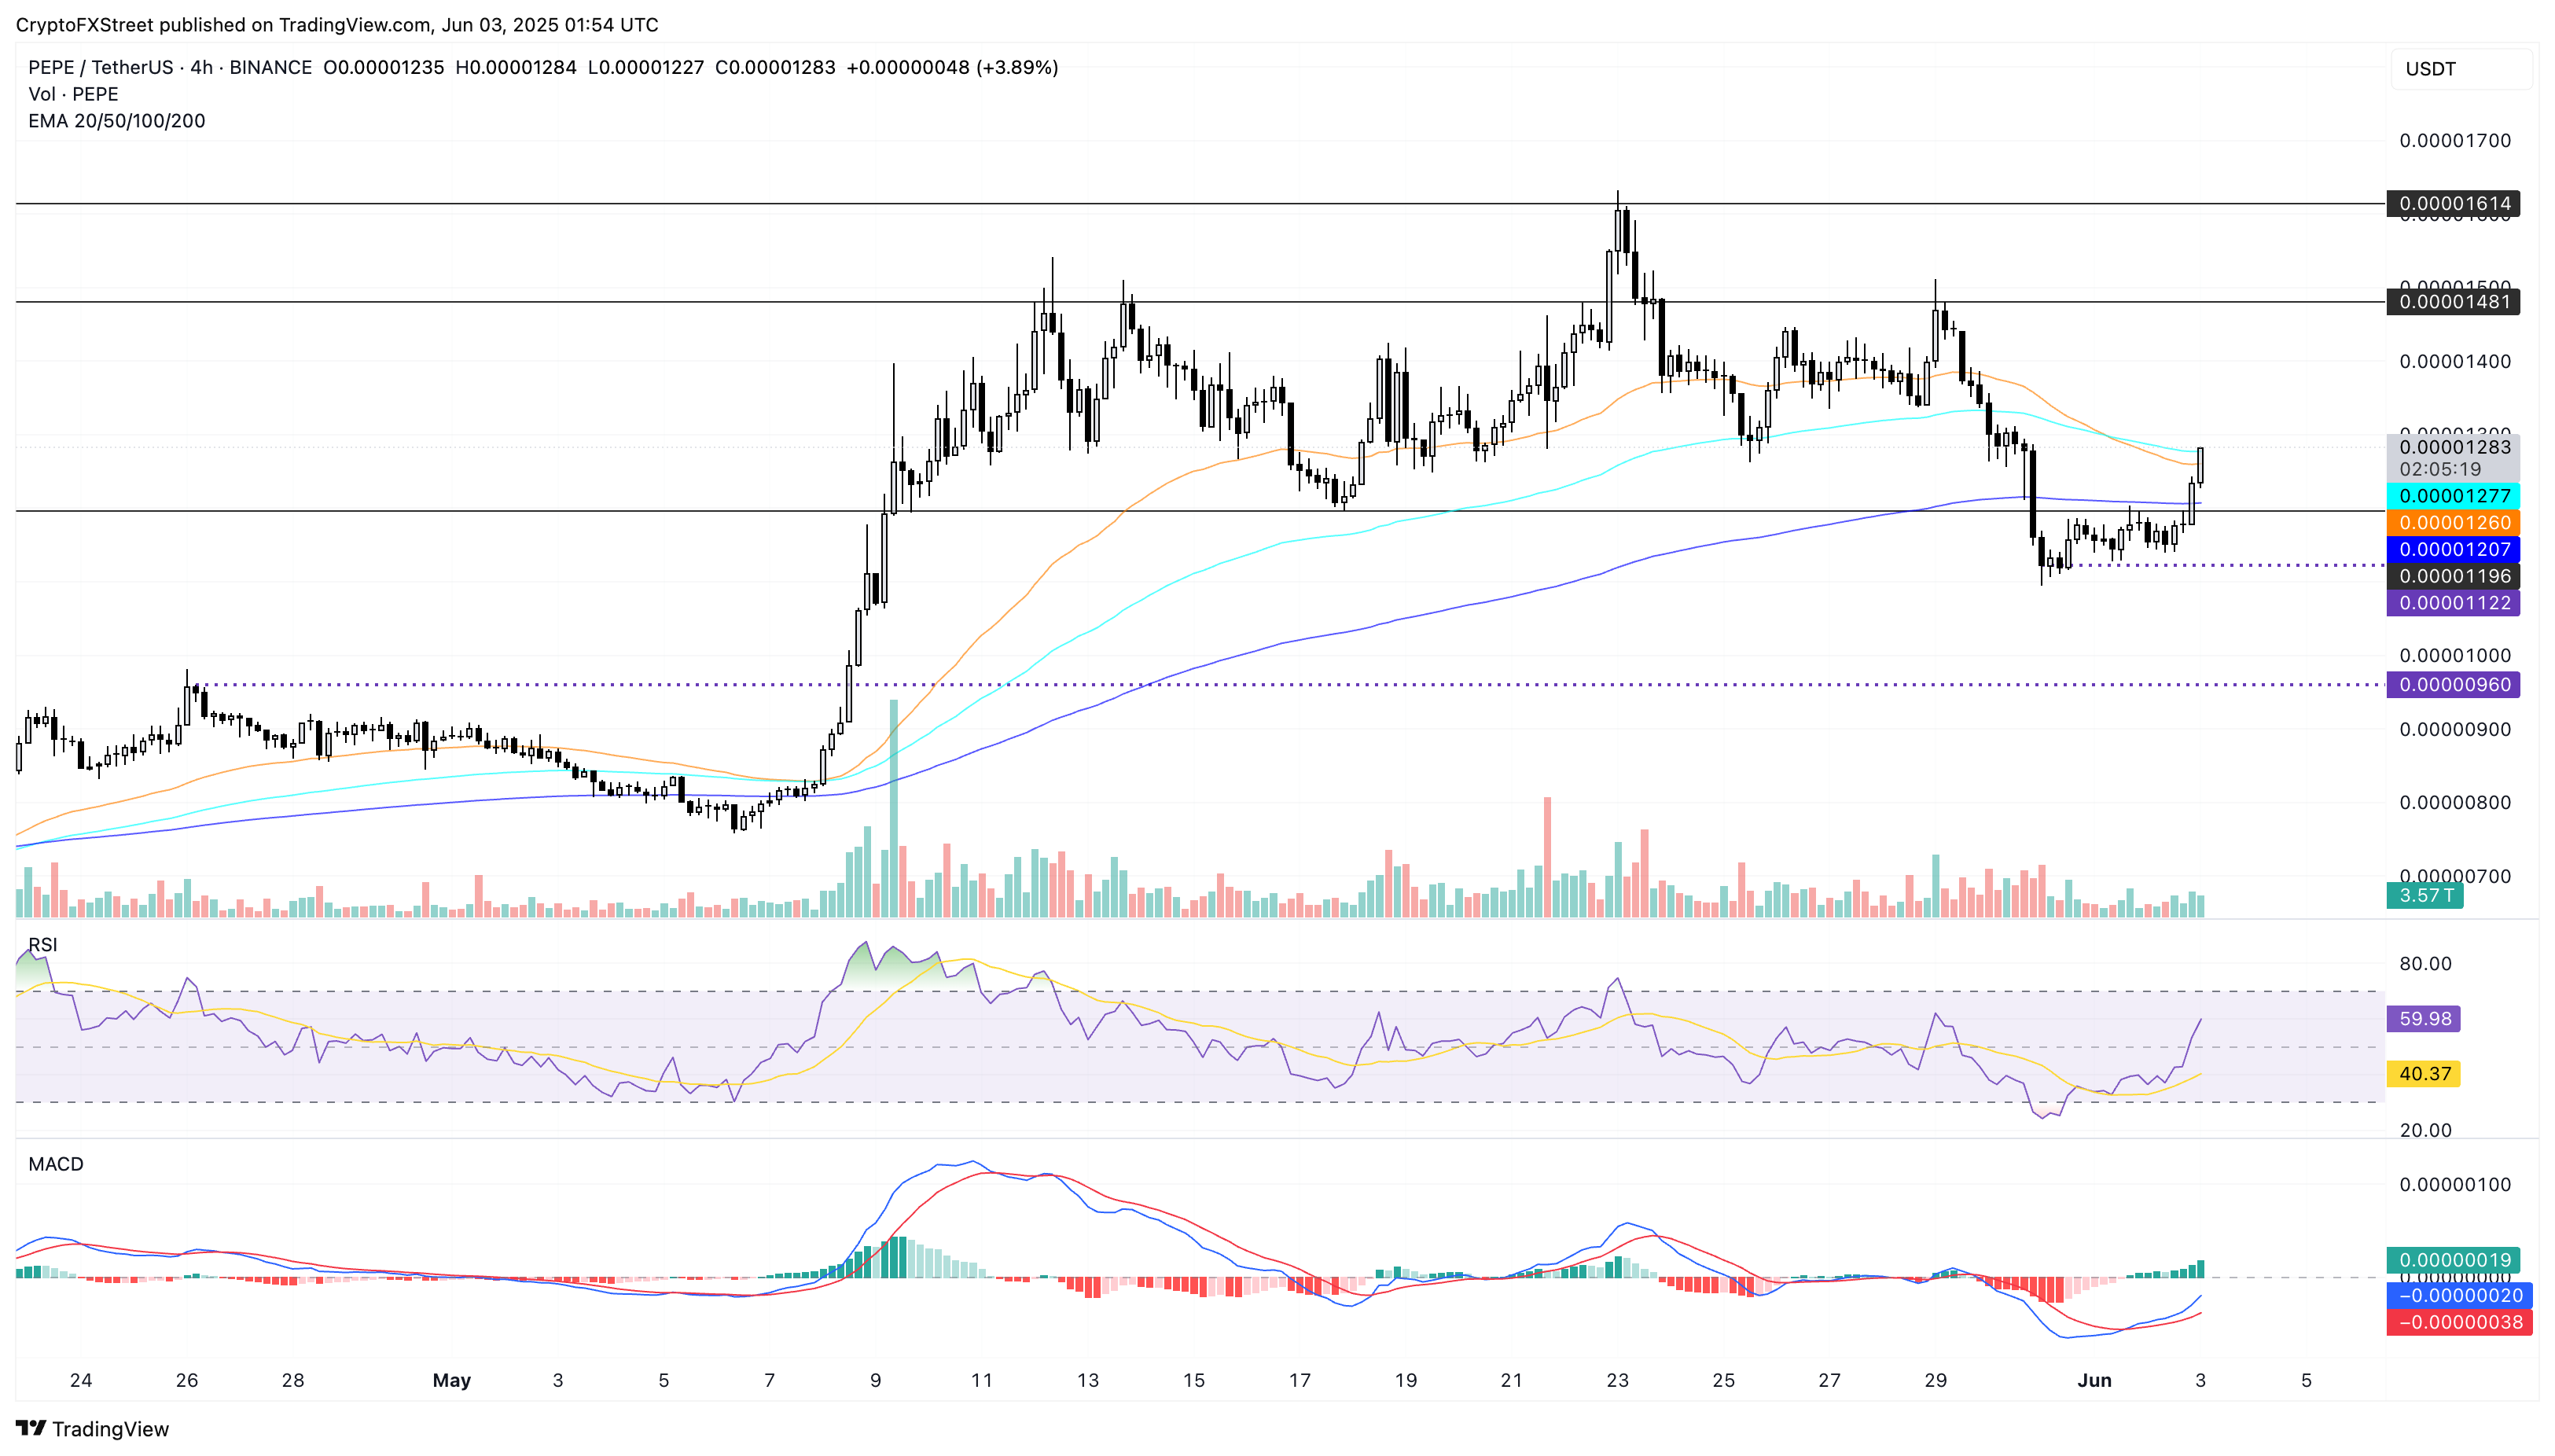
PEPE/USDT 4-hour price chart. Source: Tradingview
Conversely, a close below the $0.00001196 support level will undermine recovery rally chances for PEPE.